Assessing Polychlorinated Biphenyls (PCBs) Contamination in Indoor Dust among University Students in Ilorin, Nigeria
Download
Abstract
Background: This study aimed to assess the contamination of Polychlorinated Biphenyls (PCBs) in indoor dust among university students in Ilorin, Nigeria.
Methods: One hundred (100) indoor dust samples were collected from different locations within university hostels. Two Universities in Ilorin were sampled for the study; the Univerisity of Ilorin and Al-Hikmah University. Gas chromatography-mass spectroscopy (GC-MS) was employed to analyze and identify fourteen PCB congeners.
Results: The results revealed that university students were exposed to low levels of PCB contamination in indoor dust. The concentrations of individual PCB congeners ranged from 4.993ng/g to 37.701ng/g. Notably, PCB-52 and PCB-118 were the predominant congeners, with mean concentrations of 37.701ng/g and 30.928ng/g. Conversely, PCB-44 exhibited the lowest occurrence, with a mean concentration of 4.993ng/g. The study found positive correlations among specific PCB congeners, suggesting familiar sources and environmental behaviors. However, no significant correlations were found between residential characteristics and measured PCB levels.
Conclusion: The results emphasize the need for further research to minimize PCB contamination in indoor environments and protect human health. It is recommended that PCB levels be monitored in indoor environments and enforce strong regulations to control PCB production, use, and disposal.
Introduction
The oily liquids known as polychlorinated biphenyls (PCBs) range in color from light yellow to deep yellow. They are well-known for having remarkable qualities like flame resistance, thermal stability, insulating power, acid and oxidation resistance, and hydrolysis resistance. Due to their distinct physical and chemical properties, several goods, most notably transformers and power capacitors use them extensively [1]. Closed electrical systems accounted for 61% of PCB usage before 1971, followed by nominally closed systems at 13% and open-end applications at 26%. After 1971, however, closed electrical systems were the primary application for almost all PCBs [2].
According to the placement of chlorine atoms in the benzene ring, there are theoretically 209 distinct PCB congeners. However, there are only about 130 in reality. Among them, the International Union of Pure and Applied Chemistry (IUPAC) keeps track of 41 significant congeners. Aroclor, Pyranol, or Pyroclor in the United States; Phenoclor and Pyralene in France; Clophen and Elaol in Germany; Kanechlor and Santotherm in Japan; Fenchlor and Apirolio in Italy; and Sovol in the Soviet Union are only a few of the trade names used to refer to PCBs in various nations [2].
Although PCB production was stopped in the 1980s, it has continued to be found in people, wildlife, and environmental media due to its extensive usage over the past few decades [3,4]. Inadequate disposal during industrial production, transportation leaks, and the burning of solid waste (wood) and fossil fuels containing PCBs are all ways that roughly 1000 tonnes of PCBs are released into the environment annually [5-7].
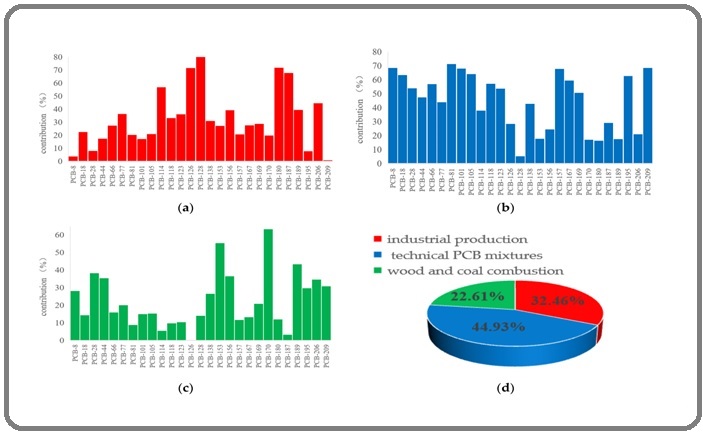
Figure 1 shows the source profiles of PCBs using positive matrix factorization (a–c). The bars show how much each factor contributed to the relevant PCB. (d) The pie chart [8] illustrates how much each element contributed to the overall amount of PCBs.
Figure 1. The Source Profiles of PCBs Using Positive Matrix Factorization (a–c).
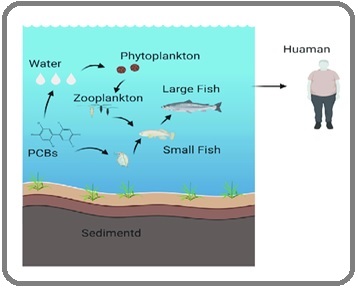
These issues are brought on by the massive amounts of PCBs discharged into the environment and their carcinogenic potential, developmental toxicity, and adverse effects on human and wildlife health [9]. When exposed over an extended period, lipophilic, hydrophobic, and persistent PCBs can cause vulnerabilities in people’s skin, liver, gastrointestinal tract, immune system, and brain system [10]. Additionally, studies on animals have shown that some PCB congeners possess carcinogenic qualities, which can be strengthened when coupled with additional substances [11] (Figure 2).
Figure 2. Diagram Illustrating the Accumulation of PCBs in the Food Chain [12].
The 12 dioxin-like and six indicator PCBs, two of the 209 PCB congeners, are mainly concerned because of their severe toxicity and considerable ambient quantities. 3,30-dichlorobiphenyl (PCB-11), a non-Aroclor PCB congener, has received attention recently because of its ubiquitous occurrence and probable emission sources connected to the manufacture of yellow pigment [13-15]. Recently, attention has increased on the efficient medium and pathway for PCB exposure that has emerged: household dust. It is critical to analyze the exposure to PCBs in dust and its associated health impacts because measuring the amounts of contaminants in indoor dust can be used as a stand-in for determining exposure potential to contaminants in indoor environments. Additionally, dust exposure to PCBs is a significant exposure pathway. Studies have demonstrated higher serum PCB levels in houses with high dust-PCB concentrations and a positive correlation between PCB concentrations in vacuum-cleaner dust and human serum. PCB exposure is significantly influenced by unintentional household dust ingestion and inhalation, especially in young infants [13, 16, 17]. Increased exposure to PCBs during pregnancy and the early years of children has been related to increased risks of childhood leukemia and adverse immunological and neurological effects, including lowered IQ [18-20].
Few researchers have repeated sampling in the same residences to characterize the variability of dust measurements over time, although several have measured PCBs in the dust. When assessing the health impacts associated with chemical exposures and accounting for exposure measurement errors, it is essential to comprehend the variance ratios between within-subject and between- subject variability [21, 22].
Due to PCBs’ persistence, bioaccumulation, and negative consequences, they were included in the Stockholm Convention on Persistent Organic Pollutants and subsequently banned or removed from trade. Determining the PCB concentrations in dust samples collected from the University of Ilorin dorms, where students spend significant time participating in academic activities, is crucial due to their prevalence and known toxicity. Recently, interest in house dust as a significant PCB medium and exposure pathway has grown, stressing the necessity of determining exposure levels and consequent health impacts. Therefore, this research aims to evaluate the levels of PCBs in dust samples for ecological and health risk assessments, including the identification of potential sources of PCB contamination in dust.
Materials and Methods
Acetone, hexane (pesticide grade), and five PCB congener standard solutions were used to create a standard calibration solution that contained 209 PCB congeners. In November 2022, dust samples were collected from ten (50) separate hostels at the University of Ilorin and Al-Hikmah University for a total of 100 samples. The hostels’ dust samples were collected using a standardized procedure with a Hoover [17]. The dusts were gathered, bagged in plastic, and kept at 20°C for additional examination. The vacuum tubing was scrubbed clean with an isopropanol-impregnated disposable wipe before sampling. The dust samples were sieved, kept at 4°C until analysis, and stored in glass jars. To fill the void capacity, precisely weighed dust aliquots (0.15 g) were added to 66 mL cells that had already been cleaned and contained Florisil and Hydromatrix (Varian Inc., UK). Before pressurized liquid extraction, internal (surrogate) standards (15 ng of each BDE 77 and BDE 128 and 30 ng of 13C12-BDE 209) were added. The conditions were 90 °C and 1500 pressure. By loading the extracted materials into solid-phase extraction (SPE) cartridges with pre-cleaned acidified silica, the extracted samples were purified after being concentrated using Zymark Turbovap® II. For further analysis, the analytes were evaporated and reconstituted in isooctane after being eluted with hexane: dichloromethane combination.
In order to prepare samples for chromatographic analysis, known procedures from earlier investigations were used. The quantities of PCB in the samples were quantified using a gas chromatograph (Agilent Model 7890A) coupled with a mass-selective detector (Varian 3800/4000 GC-MS). An HP-5 fused silica capillary column (5% phenyl-95% dimethyl polysiloxane) with particular parameters (30 m length 0.25 mm i.d. 0.25 m film thickness) was utilized to obtain separations. The temperature program includes a 120 °C initial column temperature (holding time 1 min), a 20 °C min1 ramp to 190 °C, a 5 °C min1 increase to 230 °C, and a 25 °C min1 ramp to 300 °C (holding time 10 min). Temperatures were established for the injector and transfer line at 280 and 300 °C, respectively. The carrier gas was high-purity helium, flowing at a constant rate of 0.8 mL per minute. A 1 L injection volume was applied to the GC-MS instrument in splitless mode for sample analysis. With automatic gain control, the mass spectrometer worked in electron impact ionization (EI) mode. While selected ion monitoring (SIM) mode was used for focused compound analysis, full scan mode in the m/z range of 50–500 was used for data collecting. The identities of the PCBs in the samples were ascertained using the retention periods of genuine PCB standards and the abundance of quantification and confirmation ions. To assure accuracy, 100 ng of PCB standard was added as the internal standard to the sample extracts. The resultant solutions were concentrated to 100 L and transferred to a 200 L glass insert in a 2-mL amber autosampler vial for sample analysis. The extracts were 500 L concentrated in the IHSC samples. The concentrations of all PCB congeners found in the chromatographic peaks were measured.
Samples, solvent blanks, and a quality control reference standard were all included in each analysis batch. Before analysis, the samples were concentrated and stored. To verify contamination, solvent blanks were processed using the same analytical approach. The performance of the reference standard, which was made up of spiked PCBs, was compared to certified values. To guarantee accurate and trustworthy results, quality control methods such as the relative standard deviation and limits of quantification were put in place. Paired sample correlation was used to evaluate the relationships between various rainy seasons and the chosen parameters. The correlation’s significance threshold was set at 0.05 (2-tailed). Plots were also produced using either R version 3.4.1.
Results and Discussion
Figures 3 and 4 show the PCB concentrations in the examined indoor dust samples, with concentrations for each targeted PCB. In all, PCBs 2, 101, 52, 16, 77, 118, 18, 15, 28, 105, 44, 114, 204, and 149 were found in the sample.
Figure 3. Concentrations of Individual PCBs in All Samples.
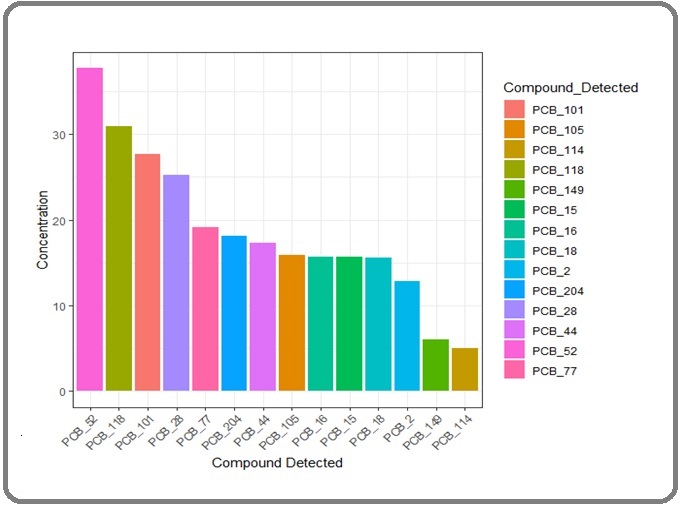
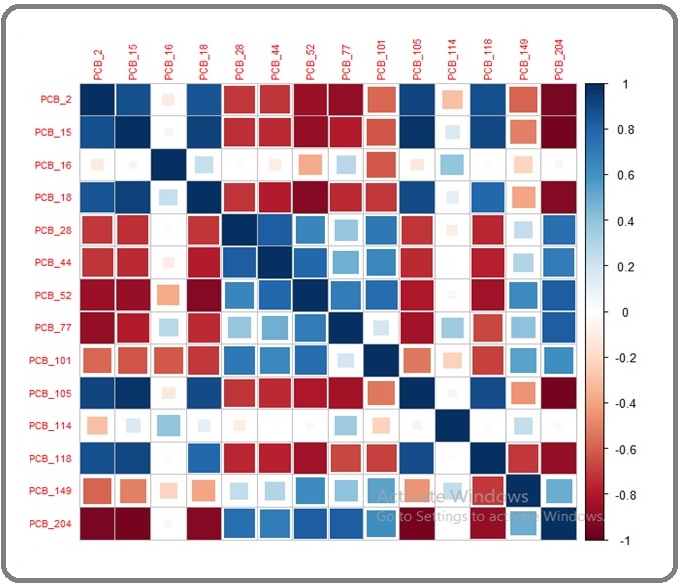
Figure 4. Correlations between Levels of Compounds in House Dust.
In Table 1, the names of the chemicals found are further explained.
Table 1. Names of Compounds Detected.
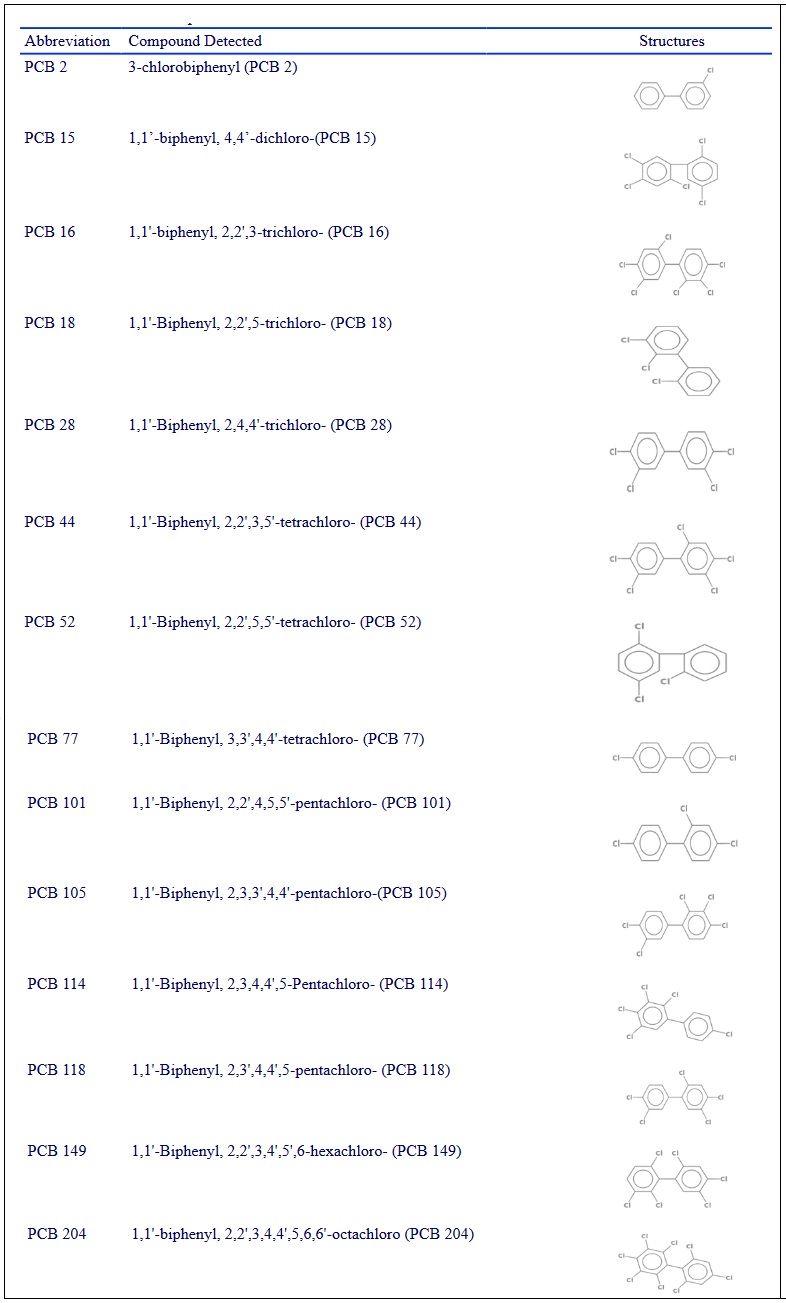
Data summary observations for several PCB (Polychlorinated Biphenyls) chemicals are provided in Table 2 (table 1).
| Parameters | No of Observations | Minimum (ng/g) | Maximum (ng/g) | Mean (ng/g) | Std. Dev. (ng/g) | CV (ng/g) | EPA Reference Level (ng/g) |
| PCB_2 | 100 | 1.4 | 36.5 | 12.881 | 14.573 | 11.31 | Low |
| PCB_15 | 100 | 1.5 | 33.5 | 15.692 | 13.102 | 8.352 | Low |
| PCB_16 | 100 | 1.3 | 33.9 | 15.712 | 11.195 | 7.129 | Low |
| PCB_18 | 100 | 1.9 | 37.1 | 15.631 | 11.799 | 7.543 | Low |
| PCB_28 | 100 | 20.4 | 31.8 | 25.285 | 4.022 | 1.594 | Low |
| PCB_44 | 100 | 2.2 | 50.3 | 17.36 | 14.166 | 8.165 | Low |
| PCB_52 | 100 | 2.2 | 60.4 | 37.701 | 16.863 | 4.476 | Low |
| PCB_77 | 100 | 0 | 35.3 | 19.125 | 12.43 | 6.502 | Low |
| PCB_101 | 100 | 0 | 41.1 | 27.712 | 14.35 | 5.18 | Low |
| PCB_105 | 100 | 1.6 | 40 | 15.929 | 15.033 | 9.441 | Low |
| PCB_114 | 100 | 0 | 19.2 | 4.993 | 6.895 | 13.805 | Low |
| PCB_118 | 100 | 20.7 | 47.4 | 30.928 | 8.943 | 2.892 | Low |
| PCB_149 | 100 | 0 | 19.5 | 6.002 | 7.58 | 12.633 | Low |
| PCB_204 | 100 | 0 | 36.4 | 18.141 | 13.063 | 7.205 | Low |
Key, CV, Coefficient of variation
The number of observations, lowest and maximum values in ng/g, mean concentration, standard deviation (std. dev.), coefficient of variation (CV), and the EPA (Environmental Protection Agency) Reference Level in ng/g are all metrics that are used to represent each chemical.
Each PCB chemical has 100 observations in the dataset, which indicates a sizable sample size for the study. The minimum and maximum values were used to analyze the range of concentrations seen for each chemical. For instance, PCB_2 illustrates the variation within the dataset with a range of 1.40 ng/g to 36.50 ng/g. For each PCB constituent, the mean concentration gives the average value. For instance, the mean concentration of PCB_2 is 14.57 ng/g, representing the usual level seen in the samples. The standard deviation measures the dispersion of the data points around the mean. A higher standard deviation shows more significant concentration variability, whereas a lower one denotes greater consistency. By comparing the standard deviation to the mean and expressing the result as a percentage, the coefficient of variation (CV) provides a relative measure of variability. A larger CV denotes more relative concentration variability. The PCB compounds’ CV values range from 1.59 for PCB_28 to 13.80 for PCB_114.
The United States Environmental Protection Agency’s acceptable threshold is also represented in the dataset by the EPA Reference Level for each PCB constituent. The fact that every chemical on the list has a low EPA Reference Level in this instance suggests that the observed amounts are below the established limit. This assurance shows that the measured quantities are considered safe by EPA guidelines.
According to Figure 3, the discovery of 14 PCB compounds at low concentrations in settled house dust sheds essential light on the existence and dispersion of these persistent pollutants. Due to PCBs’ predominant use in industrial applications and older electrical goods rather than contemporary electronics, there are few in household dust. The number of PCBs in household dust can vary depending on the age of the building and the specific forms of electrical waste generated there [4]. The reported low levels of PCBs in household dust by Ward et al. [18] in Singapore (2.6 ng g1) and Japan (1.5-2.2 ng g1) show consistency with the current experiment when comparing the results with earlier studies.
It is important to remember that the values that were observed were lower than those that Harrad et al. [17] reported for the U.K. (500-620 pg m3) and the U.S. (48 and 200 ng g1), respectively. Similar to this study’s findings, Zhang et al.’s [7] analysis of PCB concentrations in India (690 pg m3) revealed similar results. There are several reasons for these differences in PCB levels between studies. First and foremost, the location and particular sources of pollution are significant. Variations may influence the observed levels in industrial operations, waste management procedures, and historical PCB usage. Another crucial aspect to think about when analyzing PCB emissions from electronic waste is volatility. Through the volatilization of electrical components or incorrect disposal of PCB-containing materials, PCBs can be released into the environment. According to the findings of this study, the presence of PCBs in household dust indicates that some forms of electrical waste’s volatilization are a substantial source of indoor PCB exposure.
The correlations between distinct PCB congeners in household dust are shown in Figure 4. Positive associations above 0.5 were detected in PCB 15, 18, 105, and 118 (p 0.5). With a correlation coefficient (rs) of 0.893671, PCB 105 showed the most significant number of strongly positive correlations among these congeners. According to this discovery, PCB 105 may be a potential marker for other PCBs in household dust. These congeners’ familiar origins and comparable environmental behaviors can be used to explain their positive correlations. However, more research is required to pinpoint the precise origins of these pollutants in the indoor environment. Except for a few weak negative correlations involving a few low-chlorinated PCBs, no meaningful correlations were found between residential features and measured levels of pollutants in house dust. However, earlier research discovered a connection between PCB levels in dust and the kind of flooring, suggesting that PCBs may gradually build up on surfaces [20]. Further evidence that PCB-contaminated dust can be tracked from the outer environment was provided by Mari et al. [11], who found a high positive association between PCB concentrations in house dust and entryway dust from residences.
In conclusion, in Ilorin, Nigeria, university students’ indoor dust was assessed for PCB contamination, and the results showed that different dust samples had different PCB contamination levels. Instead of being present in modern electronics, PCBs are less common in household dust because they were used in earlier electrical items. The study discovered favorable relationships between particular PCB congeners, pointing to shared origins and environmental behavior. There was, however, no discernible relationship between observed PCB levels and household features. The findings highlight the need for additional studies to reduce PCB contamination in indoor spaces and safeguard human health since PCBs may build over time. It is advised that PCB levels in indoor spaces be periodically checked, and strict rules be implemented to limit PCB manufacture, usage, and disposal.
Acknowledgements
The authors thank all students at the universities used in conducting this study.
Disclosure Statement
The authors declare that they have no competing financial interests that could have appeared to influence the work reported in this paper.
Funding
The present research did not receive any financial support.
Conflict of Interest
The authors declare that there is no conflict of interest regarding the publication of this manuscript. In addition, the ethical issues, including plagiarism, informed consent, misconduct, data fabrication and/ or falsification, double publication and/or submission, and redundancy, has been entirely observed by the authors.
Authorship Contributions Statement
Ezechinyere, C. H.: Writing, Conceptualization, Methodology, Investigation and Analysis
Alo, M. F.: Editing, Review and Data Collection.
References
- Environmental exposures to polychlorinated biphenyls (PCBs) among older residents of upper Hudson River communities Fitzgerald EF , Belanger EE , Gomez MI , Hwang S, Jansing RL , Hicks HE . Environmental Research.2007;104(3). CrossRef
- Multimedia Emissions Inventory of Polychlorinated Biphenyls for the U.S. Great Lakes States Erdal S, Berman L, Hryhorczuk D. Journal of the Air & Waste Management Association (1995).2008;58. CrossRef
- Temporal changes in PCB and DDE levels among a cohort of frequent and infrequent consumers of Great Lakes sportfish Knobeloch L, Turyk M, Imm P, Schrank C, Anderson H. Environmental Research.2009;109(1). CrossRef
- Atmospheric concentrations and potential sources of PCBs, PBDEs, and pesticides to Acadia National Park Sofuoglu SC , Sofuoglu A, Holsen TM , Alexander CM , Pagano JJ . Environmental Pollution (Barking, Essex: 1987).2013;177. CrossRef
- Atmospheric levels and distribution of dioxin-like polychlorinated biphenyls (PCBs) and polybrominated diphenyl ethers (PBDEs) in the vicinity of an iron and steel making plant Choi S, Baek S, Chang Y. Atmospheric Environment - ATMOS ENVIRON.2008;42. CrossRef
- Gas-particle partitioning and behavior of dioxin-like PCBs in the urban atmosphere of Gyeonggi-do, South Korea Kim D, Choi K, Lee D. Atmospheric Research.2011;101(1). CrossRef
- A spatial temporal assessment of pollution from PCBs in China Xing Y, Lu Y, Dawson RW , Shi Y, Zhang H, Wang T, Liu W, Ren H. Chemosphere.2005;60(6). CrossRef
- Distribution, Sources and Risk Assessment of Polychlorinated Biphenyls in Sediments from Beiluo River Han L, Chang C, Yan S, Qu C, Tian Y, Guo J, Guo J. Toxics.2023;11(2). CrossRef
- Investigation of polychlorinated biphenyl removal from contaminated soil using microwave-generated steam Di P, Chang DP . Journal of the Air & Waste Management Association (1995).2001;51(4). CrossRef
- Assessment of risk from multimedia exposures of children to environmental chemicals Mukerjee D. Journal of the Air & Waste Management Association (1995).1998;48(6). CrossRef
- Air concentrations of PCDD/Fs, PCBs and PCNs using active and passive air samplers Mari M, Schuhmacher M, Feliubadaló J, Domingo JL . Chemosphere.2008;70(9). CrossRef
- Health and environmental effects of silent killers Organochlorine pesticides and polychlorinated biphenyl Zaynab M, Fatima M, Sharif Y, Sughra K, Sajid M, Khan KA , Sneharani AH , Li S. Journal of King Saud University - Science.2021;33(6). CrossRef
- Chiral polychlorinated biphenyl transport, metabolism, and distribution: a review Lehmler H, Harrad SJ , Hühnerfuss H, Kania-Korwel I, Lee CM C, Lu Z, Wong CS . Environmental Science & Technology.2010;44(8). CrossRef
- Chiral organochlorine contaminants in blood and eggs of glaucous gulls (Larus hyperboreus) from the Norwegian Arctic Ross MS , Verreault J, Letcher RJ , Gabrielsen GW , Wong CS . Environmental Science & Technology.2008;42(19). CrossRef
- The presence of polychlorinated biphenyls in yellow pigment products in China with emphasis on 3,3'-dichlorobiphenyl (PCB 11) Shang H, Li Y, Wang T, Wang P, Zhang H, Zhang Q, Jiang G. Chemosphere.2014;98. CrossRef
- PCB-containing wood floor finish is a likely source of elevated PCBs in residents' blood, household air and dust: a case study of exposure Rudel RA , Seryak LM , Brody JG . Environmental Health: A Global Access Science Source.2008;7. CrossRef
- Polychlorinated biphenyls in domestic dust from Canada, New Zealand, United Kingdom and United States: implications for human exposure Harrad S, Ibarra C, Robson M, Melymuk L, Zhang X, Diamond M, Douwes J. Chemosphere.2009;76(2). CrossRef
- Residential exposure to polychlorinated biphenyls and organochlorine pesticides and risk of childhood leukemia Ward MH , Colt JS , Metayer, Gunier RB , Lubin J, Crouse V, Nishioka MG , Reynold P, Buffler PA . Environmental Health Perspectives. 2009 06;117(6):1007-1013.2009;117(06). CrossRef
- Immunologic effects of background exposure to polychlorinated biphenyls and dioxins in Dutch preschool children Weisglas-Kuperus N, Patandin S, Berbers GA , Sas TC , MulderPG , Sauer PJ , Hooijkaas H. Environmental Health Perspectives.2000;108(12). CrossRef
- Effects of polychlorinated biphenyls on the nervous system Faroon O, Jones D, Rosa C. Toxicology and Industrial Health.2000;16(7-8). CrossRef
- After the PBDE Phase-Out: A Broad Suite of Flame Retardants in Repeat House Dust Samples from California Dodson RE , Perovich LJ , Covaci A, Van den Eede N, Ionas AC , Dirtu AC , Brody JG , Rudel RA . Environmental Science & Technology.2012;46(24). CrossRef
- Carpet-dust chemicals as measures of exposure: Implications of variability Whitehead TP , Nuckols JR , Ward MH , Rappaport SM . Emerging Themes in Epidemiology.2012;9(1). CrossRef
Author Details
How to Cite
- Abstract viewed - 0 times
- PDF (FULL TEXT) downloaded - 0 times
- XML downloaded - 0 times