A Statistical Analysis of the Role of Various Co-variables in Determining the Number of Nodes to be Dissected in Endometrial Cancer Using the CART Model, AHGPIC
Download
Abstract
Background: The main objective of this paper is to predict the role of covariables in determining the number of nodes to be dissected in endometrial cancer, using the best regression model. Additionally, the study aims to compare the accuracy of the CART model with the traditional regression model, to accurately find and predict the co-variable in determining the number of nodes to be dissected.
Material and Methods: Data on 170 endometrial cancer patients, along with their covariates, were collected from the institute AHGPIC and used for the study. The data includes the dependent variable (total number of lymph nodes involved) and 10 co-variates (independent variables): age, postmenopausal bleeding, obstetrics history, nodal status, tumor size, histology, grade, myometrial invasion, lymphovascular space invasion, and cervical extension. The methods used include multiple regression and the CART model.
Results: The average number of lymph nodes dissected among patients with a tumor size less than 1.9 cm is 3.73 (approximately 4), while patients with a tumor size of 1.9 cm have an average of 12.4 nodes (approximately 13) dissected. Among patients with prior b/l pelvic lymphadenectomy, the average number of nodes dissected is 10.9 (approximately 11), while those with prior b/l para-aortic + b/l pelvic lymphadenectomy have an average of 14.1 nodes (approximately 14) dissected. The CART model predicts with an accuracy of 95.9%, which is higher than the multiple regression model’s accuracy of 88.3%, based on the selected covariates and validated by the receiver operating characteristics (ROC) curve.
Conclusion: The study concludes that if the tumor size is greater than 1.9 cm (approximately > 2 cm), then 12 nodes should be dissected, and if it is less than 1.9 cm (approximately < 2 cm), then approximately 4 nodes should be dissected. The classification and regression tree (CART) model is able to predict the role of the covariate, i.e., tumor size, in deciding the number of lymph nodes to be dissected for endometrial cancer patients with an accuracy of 95.9%, based on the selected covariates and validated by the ROC curve. The CART model predicts with more accuracy (95.9%) compared to the multiple regression model (88.3%).
Introduction
Lymphadenectomy remains controversial for endometrial cancer. Studies favoring omission of para-aortic lymphadenectomy are GOG 33 [1] and a Memorial Sloan Kettering series that reported 1% to 2% rates of isolated positive para-aortic nodes in clinically uterine-confined disease [2, 3]. The prognostic implications of lymph node metastasis merit upstaging from IA-B to stage IIIC. The Benedettei Panici et al 4andMedical Research Council ASTEC (Efficacy of Systematic Pelvic Lymphadenectomy in Endometrial Cancer) 5 trials of pelvic lymphadenectomy are often quoted as evidence against a therapeutic benefit of lymphadenectomy in endometrial cancer. Both trials evaluated pelvic lymphadenectomy, and 25.2% to 33% of women in the no-lymphadenectomy arms received pelvic radiation [4, 5]. Because the Aalders et al, [6] PORTEC, [7] GOG 99, [8] ASTEC-EN.5,9 and PORTEC-210 trials showed no survival improvement from radiotherapy for early-stage endometrial cancers, using pelvic radiation to sterilize nondissected nodes has decreased [6-10]. Endometrial cancer is now managed with less lymphadenectomy and less pelvic radiation. The critical oncologic question now is: If lymph nodes are less evaluated and treated, how do we know that occult nodal metastasis is not missed and undertreated, and if this leads to decreased survival? A retrospective cohort study of women with node negative, stage I to IIIB endometrial cancer (n = 152,702) identified from the 1998-2011 National Cancer Database. Multivariable Cox proportional hazards regression tested for an association of lymph node count with survival. Restricted mean survival and relative hazard curves were plotted for survival as a function of number of removed lymph nodes. ResultsAmongwomen with node-negative endometrioid endometrial cancer,for each additional fivelymph nodes removed, the hazard for death decreased: stage I, the hazard ratio (HR) was 0.95 (95% CI, 0.93 to 0.97; P< .001). When grouped by grade, each additional five lymph nodes removed was also associated with decreased hazard for death: grade 1, HR was 0.96 (95% CI, 0.93 to 0.99; P = .009); grade 2, HR was 0.91 (95% CI, 0.89to 0.94;P< .001). Conclusion was that increased lymph node count is associated with a 1% to 14% decreased hazard of death per each additional five lymph nodes removed and a 5% to 20% increased 5-year survival among women with pathologically node-negative endometrioid and serous endometrial cancers [6, 10]. Of 11,443 patients, the median age was 64 years (range, 22-74 years). In all, 78.7% had stage I disease, 10.3% had stage II disease, and 11.0% had stage III disease; 31.5% had grade 1 histology, 40.6% had grade 2 histology, and 24.3% had grade 3 histology. The median number of lymph nodes reported was 9 (range, 1-90 lymph nodes). The median number of lymph nodes and the percent of patients with positive lymph nodes have increased from 1988 to 2001.
An increasing number of lymph nodes removed was associated with a higher likelihood of identifying those with lymph node metastases. Based on the logistic regression model, the largest increase in probability of detecting at least a single positive lymph node was observed when 21 to 25 lymph nodes were resected (odds ratio [OR] of 1.45; 95% confidence interval [95% CI], 1.08-1.94 [P < .01]). Removing greater than 25 lymph nodes did not improve the statistical probability (OR of 1.23; 95% CI, 0.94-1.61 [P = .13]). The current study data suggest that the removal of 21 to 25 lymph nodes significantly increases the probability of detecting at least 1 positive lymph node in endometrioid uterine cancer. The definition of an adequate lymphadenectomy deserves further investigation [7].
The identification of the number of positive lymph node in an early stage may prevent the progress of advance stage cancer among the cancer patients.
The effective number of lymph node dissection may vary based on the characteristics of different cancers. Early detection and dissection of affected lymph node significantly improves the survival of the patients.
At the same time, it is also important that, unnecessary dissection of the lymph nodes may cause vaginal bleeding, nerve or vessel damage, wound infection, blood clots and damage to nearby tissues.So, it is very important to identify the patients at highrisk and to prevent their critical conditions it is also need to extract the required number of lymph nodes.
Therefore, it is very important to identify the patients at high risk and need to extract the required number of lymph nodes. To identify the patients at risk and to prevent their critical conditions, here we proposed a CART model to predict the required number of lymph node dissection using the information on selected co-variates. For this study, we use CART approach to predict the required number of lymph node dissection using the available information on selected co-variates. CART is a non-parametric statistical modelling technique and free from any distributional assumption, which can be used to analyze the data suffering from abnormal distribution or distribution not known. For its simplicity in modelling and interpretation, it has been widely used in Statistics, Health Science, Computer Science and Metrological Science [8]. The method was pioneered by Morgan and Sonquist (1963), later developed by [9] Breiman et al. (1984). CART can be used as an alternative technique as it has several advantages over traditional statistical techniques [10].
Materials and Methods
The data for this paper was collected on The data for this paper was collected wherein dependent variable is total number of lymph node involved and 10 co-variates (were independent variables) age, Postmenopausal Bleeding, Obstetrics History, Nodal Status, Tumor Size, Histology.
Grade, Myometrial Invasion, Lymphovascular Space Invasion and Cervical Extension. 3.2 Validation of models The validation of a predictive model can be performed by the help of different measures viz. sensitivity, specificity, positive predictive value, negative predictive value and area under ROC curve. Some measures of validating the model are described as follows; (Table 1).
| Predicted value | |||
| Category-1 | Category-2 | ||
| Actual value | Category-1 | a (true positive) | b (false positive) |
| Category-2 | c (false positive) | d (true negative) |
Coefficient of determination (R²)
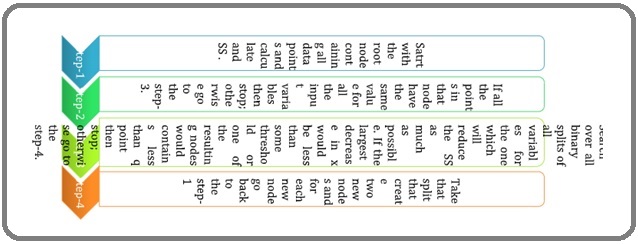
The coefficient of determination, usually denoted as R² or r², is the proportion of the variation in the dependent variable that is predictable from the independent variable and can be calculated by using the following expression; Where, RSS is the residual sum of squares, TSS is the total sum of squares and can be calculated by; (Figure 1).
Figure 1. Residual Sum Square (RSS) Total Sum Square (TSS) Regression Tree Splitting Steps.
Inclusion Criteria
Cases who underwent comprehensive surgical staging including lymphdenectomy.
Exclusion Criteria
Cervical cancers and other gynaecological malignancies like ovary.
Methods
Multiple regression and cart model. (regression tree model).
22.A total of 170 endometrial cancer patients has been taken for the said study. The descriptive statistics of the patients under study has shown in Table 2.
| Patient’s Characteristics | Mean ± SD | Range (min, max) | |
| Age (in years) | 56.86 ± 9.01 | 55 (25, 80) | |
| Tumor size (in c.m.) | 02.87 ± 1.49 | 7.9 (0.5, 8.4) | |
| Postmenopausal Bleeding (in days) | 381.34 ± 622.18 | 2920 (0, 2920) | |
| Node dissection (in numbers) | 09.56 ± 5.68 | 20 (0, 20) | |
| Co-variate (code) | n i (%) | Co-variate | n i (%) |
| Age | Grade | ||
| < 57 years (0) | 77 (45.3) | Grade-1 (1) | 26 (15.3) |
| ≥ 57 years (1) | 93 (54.7) | Grade-2 (2) | 106 (62.4) |
| Tumor size | Grade-3 (3) | 38 (22.3) | |
| < 3 c.m. (0) | 90 (52.9) | Lymphovascular Space Invasion | |
| ≥ 3 c.m. (1) | 80 (47.1) | Negative (0) | 152 (89.4) |
| Postmenopausal Bleeding | Positive (1) | 18 (10.6) | |
| < 381 days (0) | 116 (68.2) | Cervical Extension | |
| ≥ 381 days (1) | 54 (31.8) | Negative (0) | 147 (86.5) |
| Obstetrics History | Positive (1) | 23 (13.5) | |
| Nullipara (0) | 52 (30.6) | Nodal Status | |
| Multipara (1) | 118 (69.4) | Bplnd (pelvic) (0) | 97 (57.1) |
| Histology | Bpand (paraaortic)(1) | 73 (42.9) | |
| Nonendometrioid (0) | 26 (15.3) | Number of nodes dissect | |
| Endometrioid (1) | 144 (84.7) | < 13 (0) | 146 (85.9) |
| Myometrial Invasion | ≥ 13 (1) | 24 (14.1) | |
| < 50% (0) | 138 (81.2) | ||
| ≥ 50% (1) | 18.8 |
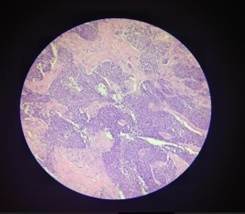
The mean age of the patients was registered as 56.86 ± 9.01 years with the range 55 (25, 80) years. Majority patients are from the age group ≥ 57 years (54.7%). More patents (nearly 53%) are having tumor size more than or equal to 3 c.m. with the range 7.9 (0.5, 8.4) c.m. The mean tumor size observed as 02.87 ± 1.49 c.m with the range 7.9 (0.5, 8.4). Most of the patients (68.2%) suffered with postmenopausal bleeding less than, 1-year. (approx) with average 381.34 ± 622.18 days and range 2920 (0, 2920) days. The nodal dissection of the patients ranges between (0, 20) with mean number of nodes 09.56 ± 5. 68. Less than 13 lymph node dissection was done among most of the patients (i.e., 85.9%). Considering obstetrics status, almost 70% of the patients are having one or more children (multipara) and nearly 30% are not having even a single child (nullipara). Most of the patients are with grade-2 (62.4%) and there are 15.3% and 22.3% patients with grade-1 and grade-3 respectively. The histology status shows that the endometrial glands present in nearly 85% and absent in nearly 15% of the patients. More than 80% of the patients are having myometrial invasion less than 50%. Only 13.5% and 10.6% of the patients are having cervical extension and lymphovascular space invasion positive status respectively.Major of the patients are with pelvic nodal status i.e., 57.1%. patients are with grade-2 (62.4%) and there are 15.3% and 22.3% patients with grade-1 and grade-3 respectively. The histology status shows that the endometrial glands present in nearly 85% and absent in nearly 15% of the patients. More than 80% of the patients are having myometrial invasion less than 50%. Only 13.5% and 10.6% of the patients are having cervical extension and lymphovascular space invasion positive status respectively. Major of the patients are with pelvic nodal status i.e., 57.1%. Here, Table 2 shows the results of traditional multiple regression modelling on endometrial cancer patient data to predict the number of lymph nodes of different endometrial cancer patients using different covariates. Two co-variates namely nodal status and tumor size are the significant predictors to predict the number of lymph nodes with p<0.05.The multiple regression model carries a lot of loads so, the assumptions of the model for normality and homoscedasticity can be verified by Shapiro-Wilk test. The Shapiro-Wilk test statistics gives W = 0.991 with p-value = 0.901, therefore null hypothesis accepted and the normality assumptions for the multiple regression model is verified (Figure 2, 3 and 4).
Figure 2. Systemic b/l Pelvic and Para Aortic Lymphdenectomy, with Omental Biopsy.
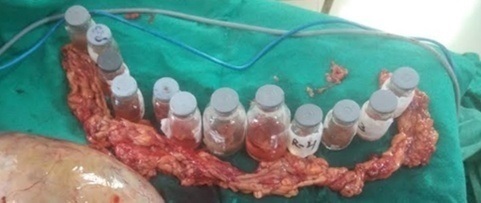
Figure 3. Pelvic Node Positive Adenocarcinima.
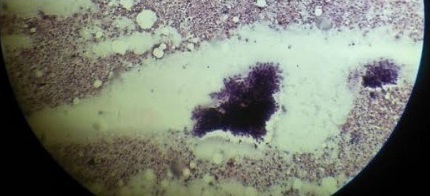
Figure 4.High Grade (3) Carcinoma Endometrium.
Analysis and Result of Regression tree Algorithm
The basic regression tree growing algorithm is as follows:
Table 2 shows a total of 170 endometrial cancer patients has been taken for the said study. The descriptive statistics of the patients under study has shown in Table 2. The mean age of the patients was registered as 56.86 ± 9.01 years with the range 55 (25, 80) years. Majority patients are from the age group ≥ 57 years (54.7%). More patents (nearly 53%) are having tumor size more than or equal to 3 c.m. with the range 7.9 (0.5, 8.4) c.m . The mean tumor size observed as 02.87 ± 1.49 c.m with the range 7.9 (0.5, 8.4). Most of the patients (68.2%) suffered with postmenopausal bleeding less than,1-year.(approx.) with average 381.34 ± 622.18 days and range 2920 (0, 2920) days. The nodal dissection of the patients ranges between (0, 20) with mean number of nodes 09.56 ± 5. 68.Less than 13lymph node dissection was done among most of the patients (i.e., 85.9%). Considering obstetrics status, almost 70% of the patients are having one or more children (multipara) and nearly 30% are not having even a single child (nullipara). Most of the patients are with grade-2 (62.4%) and there are 15.3% and 22.3% patients with grade-1 and grade-3 respectively. The histology status shows that the endometrial glands present in nearly 85% and absent in nearly 15% of the patients. More than 80% of the patients are having myometrial invasion less than 50%. Only 13.5% and 10.6% of the patients are having cervical extension and lymphovascular space invasion positive status respectively.Major of the patients are with pelvic nodal status i.e., 57.1%. patients are with grade-2 (62.4%) and there are 15.3% and 22.3% patients with grade-1 and grade-3 respectively. The histology status shows that the endometrial glands present in nearly 85% and absent in nearly 15% of the patients. More than 80% of the patients are having myometrial invasion less than 50%. Only 13.5% and 10.6% of the patients are having cervical extension and lymphovascular space invasion positive status respectively. Major of the patients are with pelvic nodal status i.e., 57.1%.
Table 3 shows the results of traditional multiple regression modelling on endometrial cancer patient data to predict the number of lymph nodes of different endometrial cancer patients using different covariates.
| Estimate | Std. Error | t-value | Pr(>|t|) | |
| (Intercept) | 1.806 | 3.091 | 0.584 | 0.559 |
| Age | 0.033 | 0.042 | 0.796 | 0.427 |
| Postmenopausal Bleeding | -0.001 | 0.001 | -0.039 | 0.969 |
| Obstetric History | -0.435 | 0.861 | -0.506 | 0.6139 |
| Nodal status | 2.312 | 0.752 | 3.074 | 0.002 |
| Tumor Size | 1.519 | 0.263 | 5.769 | <0.001 |
| Histology | -1.18 | 1.225 | -0.963 | 0.337 |
| Grade | 0.729 | 0.676 | 1.078 | 0.282 |
| Myometrial Invasion | 1.202 | 1.009 | 1.191 | 0.235 |
| Lymph vascular Space Invasion | -0.717 | 1.397 | -0.513 | 0.608 |
| Cervical Extension | 0.912 | 1.192 | 0.766 | 0.445 |
Two co-variates namely nodal status and tumor size are the significant predictors to predict the number of lymph nodes with p<0.05.
At the beginning, a regression tree holds all the data points in its root node. Further, we need a splitting criterion to split the root node. Starting with covariate tumour size and the cut-point 1.9 cm, all the women with tumour size < 1.9 cm are splitted into the left daughter node and the rest into the right daughter node. A total of 56 women went to the left node and 114 women to the right node.
The choices, tumour size and 1.9 cm are the best cut-point to split the root node.
Figure 5 shows the cart model spilttimg and analysis of the tumor size.
Figure 5. The Cart Model Spilttimg and Analysis of the Tumor Size.
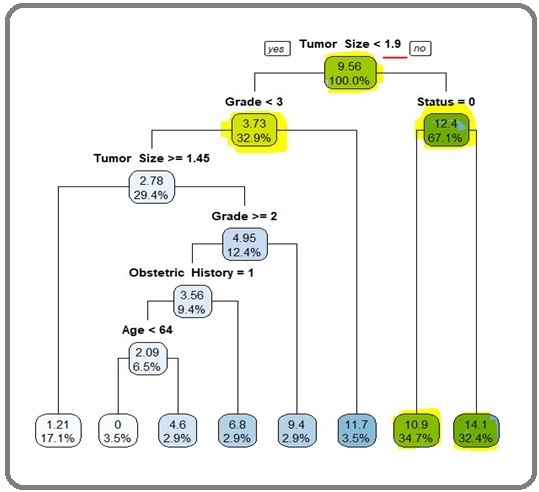
Average number of lymph node dissection among patients having tumor size less than 1.9 cm is 3.73 (approx4) and the patients having a tumor size 1.9 cm is 12.4 (aprrox 13). average nos of nodes dissection among the patients having prior dissected nodal staus as b/l pelvic lymphdenectomy 10.9 (approx 11) and patients having prior dissected b/l paraortic + b/l pelvic lymhadenectomy is 14.1 (approx14) i.e the covarite tumor size i.e highlighted in green color is significant . The other co vriates are in faint blue and sky color are less significant. if tumor size> 1.9 cm approx 2cm the 13 nodes and if less than< 1.9 cm approx 2cm then 3.73 i.e approx 4 nodes (<13) should be dissected. The second split is done on the daughter node grade as <3 and ≥3 (terminal node). Next split is done at the tumour size ≥1.9 cm, which divides the information on nodal status as pelvic (terminal node) and paraaortic (terminal node).
Further, patients with grade <3 (i.e., 1 and 2) are divided into two parts as tumour size ≥1.45 cm (terminal node) cm and <1.45 cm. Patients having tumour size <1.45 cm are partitioned again by grade ≥2 and <2 (terminal node). Subsequently, the patients with grade ≥2 are further split by obstetric status as: nullipara (0: terminal node) and multipara (1). Finally, multipara patients are divided by the last determi- nant age as <64 (terminal node) and ≥64 years (terminal node).
Finally, the splitting of nodes stops after seventh split. At each node the mean number of lymph node dissection and size (%) of the root or leaf node are reported.
This tree has eight terminal nodes. The covariates tumour size, nodal status, grade, and age play an important role to construct the regression tree.
However, the variables such as postmenopausal bleeding, obstetrics history, histology, myometrial invasion, lymph vascular space invasion, cervical extension have no role in the regression tree. The output of CART model demonstrates that there are two significant predic-tors for predicting lymph node dissection and they are tumour size and nodal status.
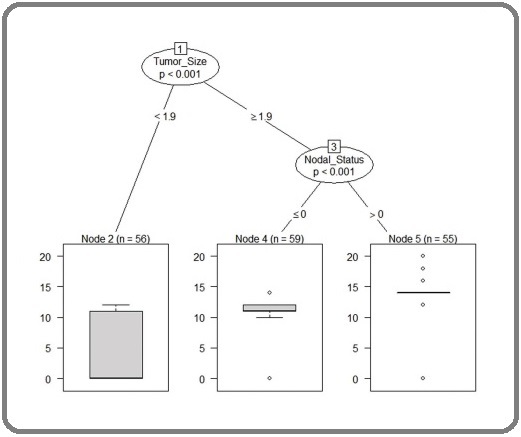
Modified CART splitting with their determinants. The outcomes of the model states that the patients with tumour size ≥1.9 cm are at higher risk of extracting additional lymph node compared to the patients having tumour size <1.9 cm. The patients with paraaortic +PELVIC lymhadenectomyare at High risk of additional lymph node compared with the patients having Pelvic lymphaddenectomy. Thus, it is more important to dissect an additional lymph node of the patients having tumour size ≥1.9 cm and paraaortic nodal status (Figure 6).
Figure 6. Modified CART Splitting with their Determinant i.e tumor size and nodal staus (i.e pelvic lymaphadenectomy/ para-aortic lymphadenectomy).
We have checked the model adequacy by plotting the residuals of both multiple and CART model (not shown here). It was also verified that the observed data coin-cide with reference line passing through origin, hence validating the assumption of normality of the error term in the model (Figure 7).
Figure 7. Scatter Plot of Age vs node.
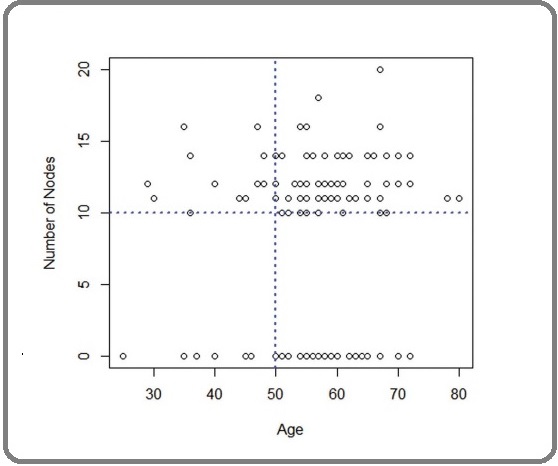
It is clear that, the age predictor of the patients is explaining the high and low risk of extraction of lymph node. Hence, the patients under study can be classified into two major groups based on their ages i.e., <50 and ≥50 . The outcomes of the model states that the patients with tumour size ≥1.9 cm are at higher risk of extracting additional lymph node compared to the patients having tumour size <1.9 cm. Similarly, the patients with nodal status as paraaortic are at high risk of extracting additional lymph node compared with the patients having pelvic nodal status. Thus, it is more important to dissect an additional lymph node of the patients having tumour size ≥1.9 cm and paraaortic nodal status.
We have checked the model adequacy by plotting the residuals of both multiple and CART model (not shown here) shows number of lymph nodes is mostly scattered in the upper part of the blue horizontal line, indicating that the majority of patients have ≥10 nodes. Further, the upper data is more scattered towards the right-hand side of the blue vertical line, indicating the major patients those ≥10 lymph nodes dissected are belongs to age ≥50. It is clear that, the age predictor of the patients is explaining the high and low risk of extraction of lymph node. Hence, the patients under study can be classified into two major groups based on their ages i.e., <50 and ≥50 .Nos of nodes as 13 as an optimal threshold value for the dependent variable, and it can be stratified as <13 and ≥13 two groups, which can be used further for validating and comparing the predictive models.
Cross tabulation of predicted vs actual value for both multipleregression & CART model for two groupsi.e <13nodes and more> 13nodes (Table 4 a and b).
| Positive if Greater than or Equal To | Sensitivity | 1-Specificity | Sensitivity + Specificity-1 |
| -1 | 1 | 1 | 0 |
| 5 | 0.75 | 0.759 | -0.009 |
| 10.5 | 0.75 | 0.684 | 0.066 |
| 11.5 | 0.5 | 0.481 | 0.019 |
| 13 | 0.417 | 0.335 | 0.082 |
| 15 | 0 | 0.044 | -0.044 |
| 17 | 0 | 0.013 | -0.013 |
| 19 | 0 | 0.006 | -0.006 |
| 21 | 0 | 0 | 0 |
Measurement of Youden Index Test Variable, Number of Nodes Dissect State Variable, Age and Value of State Variable, 50
| Multiple regression | Cart | ||||
| Actual | Predictions | Actual | Predictions | ||
| < 13 | ≥ 13 | < 13 | ≥ 13 | ||
| < 13 | 106 | 6 | < 13 | 110 | 2 |
| ≥ 13 | 40 | 18 | ≥ 13 | 5 | 53 |
Comparision of ROC Curve of Both the Models
Therefore, we can take 13 as an optimal threshold value for the dependent variable, and it can be stratified as in order to compare the predictive power of the CART model with the multiple regression model, we draw two ROC curves shown in Figure 8.
Figure 8. Comparison of ROC of Multiple Regression and Cart Model.
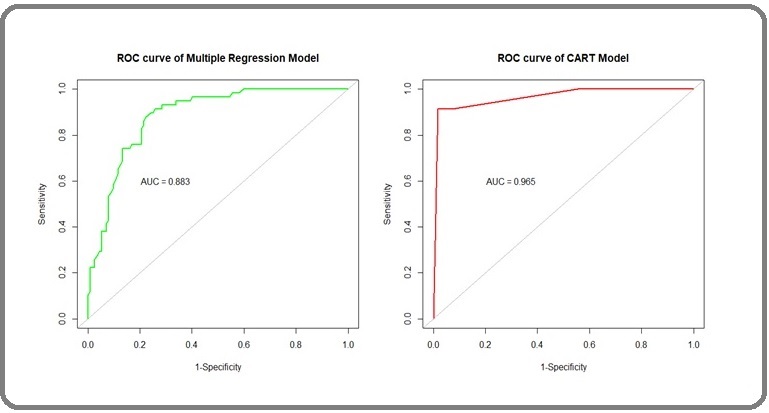
The area under the ROC curve (AUC) in 0.965 in the CART model and 0.883 in the multiple regression model. This, shows, the predictive power of the co variable i.e tumor size 1.9 cm (approx 2cm), is expected to be more sensitive and specific in the CART model than the traditional multiple regressiomodel. Table 5 shows the value of different parameters for comparing multiple regression model and CART model.
| Parameters | Multiple Regression Model | Cart Model |
| Area under the curve (auc) | 0.883 | 0.965 |
| Sensitivity | 0.726 | 0.956 |
| Specificity | 0.75 | 0.963 |
| Positive predictive value | 0.946 | 0.982 |
| Negative predictive value | 0.31 | 0.913 |
| Accuracy | 0.729 | 0.959 |
| R 2 | 0.334 | 0.754 |
Sensitivity, specificity, PPV, NPV andaccuracy are 0.726, 0.750, 0.946, 0.310 and 0.729, respectively for multiple regressionmodel and 0.956, 0.963, 0.982, 0.913 and 0.959, respectively for the CART model.The accuracy of CART model over multiple regression model shows that CART canbe considered as a better alternative to multiple regression model particularly for analysing EC data.
Discussion
From the data average number nodes becomes 9.56 (approx.10). There are two significant predictors that can be udes to decide to the nos of nodes to be dissected by multiple regression model. However we found that classification and regression tree (CART) model is able to predict the role of the co variate i.e tumor size in deciding the number of lymph node dissection. Average number of lymph node dissection among patients having tumor size less than 1.9 cm is 3.73 (approx4) and the patients having a tumor size 1.9 cm is 12.4 (approx13). Average nos of nodes dissection among the patients having prior dissected nodal staus as b/l pelvic lymphdenectomy
10.9 (approx 11) and patients having prior dissected b/l paraortic + b/l pelvic lymhadenectomy is 14.1 (approx14). Thus CART MODEL can predict with more accuracy of 95.9% than the multiple regression model which is of 88.3%, based on the selected covariates and validated by receiver operating characteristics (ROC) curve.
Results in Context with Published Literature
A retrospective cohort study of women with node- negative, stage I to IIIB endometrial cancer (n = 152,702) identified from the 1998-2011 National Cancer Database. Multivariable Cox proportional hazards regression tested for an association of lymph node count with survival Conclusion was that increased lymph node count is associated with a 1% to 14% decreased hazard of death per each additional five lymph nodes removed and a 5% to 20% increased 5-year survival among women with pathologically node-negative endometrioid and serous endometrial cancers [6]. CART is a non-parametric statistical modelling technique and free from any distributional assumption, which can be used to analyze the data suffering from abnormal distribution or distribution not known. For its simplicity in modelling and interpretation, it has been widely used in Statistics, Health Science, Computer Science and Metrological Science [8]. The method was pioneered by Morgan and Sonquist (1963), later developed by [9] Breiman et al. (1984). CART can be used as an alternative technique as it has several advantages over traditional statistical techniques [10].
Strength and Weakness
It isfound that, CART model is able to predict the number of lymph node dissection of endometrial cancer patients with an accuracy of 95.9% based on selected variables and validated using ROC curve with the area 0.965. It is also found that, CART model has the potential advancement over traditional regression model and can be used as its alternative method.The limitation of this method is that, it only considers a covariate or multiple covariates at a time and ignore the level of the co-variates. the limitation of this method is that, it only considers a covariate or multiple covariates at a time and ignore the level of the co-variates. To overcome these limitations, here we develop a regression tree.
Implication of Application in Future Research
Researchers are looking ways to estimate the number of lymph nodes for different cancer patients using some measurements such as age, sex, co-morbidities etc. The covariates tumor size and early detected nodal status from lymph node sampling are found as two significant predictors to decide the number of lymph node need to dissected. This cart model will help us in predicting with accuracy the number of nodes to be considered dissection, so that unecessary morbidities and mortalities can be avoided in endometrial cancer.
In conclusion, the covariates tumor size and early detected nodal status from lymph node sampling are found as two significant predictors to decide the number of lymph node need to dissecting order to avoid the critical conditions and to take appropriate remedies or treatment at an early stage to optimize their loss in terms of time and money and life by the multiple regression model.
We found that classification and regression tree (CART) model is able to predict the role of the co variate i.e tumor size in deciding the number of lymph node dissection for the EC patients with an accuracy of 95.9% based on the selected covariates and validated by receiver operating characteristics (ROC) curve. Thus CART MODEL can predict with more accuracy of 95.9% than the multiple regression model which is of 88.3%, based on the selected covariates and validated by receiver operating characteristics (ROC) curve. Thus we conclude that if tumor size >1.9cm (approx> 2cm) the 13 nodes and if less than1.9cm (approx< 2cm) then 3.73 i.e approx 4 nodes i.e <13 should be dissected.
We demonstrated the demographic. clinical and pathologicalcovariates that has facilitated insight into the prediction of lymph node dissection using CART m.
Purpose
The above study will be of help in deciding the nos of nodes to be dissected in endometrial cancer so, that unnecessary morbidities like bleeding and lymphoedem, and waste of resources i.e money and time.
Software used for data analysis and plotting
All the statistical analysis and plotting were done by using R (version 3.6.2) and SPSS (version 20).
Acknowledgments
Statement of Transparency and Principals:
· Author declares no conflict of interest
References
- Comprehensive surgical staging for endometrial cancer Rungruang B, Olawaiye AB . Reviews in Obstetrics & Gynecology.2012;5(1).
- Surgical pathologic spread patterns of endometrial cancer. A Gynecologic Oncology Group Study Creasman WT , Morrow CP , Bundy BN , Homesley HD , Graham JE , Heller PB . Cancer.1987;60(8 Suppl). CrossRef
- The incidence of isolated paraaortic nodal metastasis in surgically staged endometrial cancer patients with negative pelvic lymph nodes Abu-Rustum NR , Gomez JD , Alektiar KM , Soslow RA , Hensley ML , Leitao MM , Gardner GJ , et al . Gynecologic Oncology.2009;115(2). CrossRef
- Systematic pelvic lymphadenectomy vs. no lymphadenectomy in early-stage endometrial carcinoma: randomized clinical trial Benedetti Panici P, Basile S, Maneschi F, Alberto Lissoni A, Signorelli M, Scambia G, Angioli R, et al . Journal of the National Cancer Institute.2008;100(23). CrossRef
- Efficacy of systematic pelvic lymphadenectomy in endometrial cancer (MRC ASTEC trial): a randomised study Kitchener H, Swart AM , Qian Q, Amos C, Parmar MK . Lancet (London, England).2009;373(9658). CrossRef
- Association of Lymph Node Count and Overall Survival in Node-Negative Endometrial Cancers Seagle BL , Gilchrist-Scott D, Graves S, Strohl AE , Nieves-Neira W, Shahabi S. JCO clinical cancer informatics.2017;1. CrossRef
- Lymphadenectomy in endometrioid uterine cancer staging: how many lymph nodes are enough? A study of 11,443 patients Chan JK , Urban R, Cheung MK , Shin JY , Husain A, Teng NN , Berek JS , et al . Cancer.2007;109(12). CrossRef
- Extending the linear model with R: generalized linear, mixed effects and nonparametric regression models. Chapman and Hall/CRC. Faraway JJ . 2016.
- Classification and regression trees. Boca Raton, FL: Chapman & Hall Breiman L , Friedman JH , Olshen RA , Stone CJ . 1984.
- Decreasing costs and improving outcomes in systemic lupus erythematosus: using regression trees to develop health policy Clarke AE , Bloch DA , Danoff DS , Esdaile JM . The Journal of Rheumatology.1994;21(12).
License

This work is licensed under a Creative Commons Attribution-NonCommercial 4.0 International License.
Copyright
© Asian Pacific Journal of Cancer Biology , 2024
Author Details