Considerations Regarding CHSY1 Knockdown and Its Influence on Gene Expression Profiles: A Perspective from Protein Interaction Network Analysis
Download
Abstract
Introduction: Knockdown of CHSY1 in ovarian cancer holds promise for monitoring tumorigenesis and the application of targeted therapies.
Method: A comparison was made between microarray datasets of ovarian cancer with and without CHSY1 knockdown to identify differentially expressed genes (DEGs). Subsequently, the DEGs were analyzed using Cytoscape and its plug-ins. All key genes in the protein-protein interaction (PPI) network originated from the expression dataset which exhibiting significant differential expressions.
Result: Particularly PTEN, STAT3, BRCA, CCND1, and HIST1H4I emerged as central hub-bottlenecks within the PPI network following CHSY1 knockdown.
Conclusion: This compilation suggests that the candidate genes and their associated biological processes may have substantial connections to the effects of knockdown, inhibiting some cancer-related genes to prevent cancer progression.
Introduction
While recent advancements in ovarian cancer research has led to significant molecular and biomarker discoveries, shedding light on the disease’s underling mechanisms and offering new avenues for diagnosis and treatment. Ovarian cancer emerges as one of the malignant cancers on a global scale. The need for molecular investigations and studies at the molecular level is on the rise. The enzyme, Chondroitin synthase-1 (CHSY1) is reported as a highly expressed gene in ovarian cancer that its Knockdown could be beneficial. In a way that many cancers’ development and progression is correlated to the high level of this protein in human body. It is also known that the invasive behavior of ovarian cancer could be associated with CHSY1 expression levels [1]. This gene has been proved to be a key player in development of ovarian and colon cancers [2]. The studies demonstrated that CHSY1 expression was elevated in ovarian cancer (OC) compared to adjacent peritumour tissues. In vitro experiments assessing cell function indicated heightened CHSY1 expression in OC cells, which consequently facilitated tumor cell proliferation and invasion. The role of CHSY1 in promoting OC tumorigenesis by influencing the downstream gene TIAM1 and activating the ERK signaling pathway was further validated with complementary tests [1]. On the other hand, Protein-protein interaction network analysis offers beneficial information for studying and monitoring cancer developments. By examining how proteins interact within cellular pathways, this approach provides insights into the molecular mechanisms underlying cancer development and progression. It helps identify key protein players and their interactions, elucidating crucial pathways implicated in cancer biology. This knowledge aids in the discovery of potential therapeutic targets and biomarkers for cancer diagnosis and prognosis. Additionally, protein-protein interaction network analysis enhances our understanding of the complex interplay between various cellular components in cancer, paving the way for more precise and effective therapeutic interventions [3]. Analyzing the topology of protein-protein interaction networks holds promise for identifying the essential components within the network under study. Two significant parameters in this analysis are the degree (K) and betweenness centrality (BC) [4]. Considering this perspective, conducting computational analysis on ovarian cancer with CHSY1 knockdown holds value in enhancing our comprehension of the underlying mechanisms by which this gene promotes tumorigenesis, as well as its specific impact on the expression of other genes.
Materials and Methods
Expression profiling by array provided by GEO database and GEO2R analyzer for (GSE232722) were utilized for Ovarian cancer knockdown with shRNA for CHSY1 examinations. The knockdown as mentioned is procced with shRNA transfection. GEO2R employs statistical criteria to analyze expression data within GEO. Key statistical factors for interpretation included the p-adjusted value, LogFC, and correction methods such as the Benjamini & Hochberg (False Discovery Rate). Additionally, GEO2R offers data visualization as a statistical feature. In this study, we utilized R programming to extract this information from our dataset. All data visualization was conducted using R Studio. These assessments provided our research with a clearer understanding of the dataset’s nature and eligibility for further analysis, particularly in terms of protein-protein interaction (PPI). Within R Studio, we utilized the R script generated by GEO2R to compare groups of samples and conduct the corresponding statistical analysis. This approach afforded us a more comprehensive understanding of our analysis by delivering specific statistical features. The initial focus was on the first 250 differentially expressed genes, referred to as DEGs, which were subjected to further analysis in the context of protein interaction analysis. Cytoscape serves as a protein-protein interaction (PPI) network analyzer, facilitating the identification of physical interactions among genes or proteins and key features of the PPI network, such as degree and betweenness centrality parameters [5]. The String database integrated into By the application of Cytoscape as a resource for protein queries, with a confidence cutoff of 0.4 applied to ensure network stability assessments. In cancer search, crucial genes hold immense importance as targets for treatment approaches. The proposed method primarily seeks to innovate a new approach for pinpointing vital genes, utilizing a graph-based method [6]. Centrality measure was handled by NetworkAnalyzder software that integrated in Cytoscape. NetworkAnalyzer examined the topological characteristics of the PPI network, identifying the most crucial hubs and bottlenecks. Nodes with elevated degree and betweenness centrality values are categorized as hub-bottlenecks, while those with high degree values but insignificant betweenness centrality are termed non-bottlenecks. Similarly, nodes with low degree but high betweenness centrality values are referred to as hub-non-bottlenecks [7]. Gene ontology encompasses cellular component, biological process, and molecular function, all of which were taken into consideration for the central nodes in our study. ClueGO and CluePedia plugins were employed in Cytoscape for this analysis. These applications are highly applicable for annotations of the central genes and utilizes experimental data to compute both linear and non-linear statistical dependencies. It connects genes, proteins, and miRNAs through in silico and/or experimental information, integrating them into a ClueGO network of terms and pathways [8].
Results
The groups for comparison consist of 1. Control Ovarian cancer cells, and 2. Ovarian cancer cells with CHSY1 knockdown by shRNA consists of three samples. In GEO2R, utilizing boxplots can effectively illustrate the distribution of gene expression levels among sample groups, aiding in comparisons. Various components within this visualization convey distinct concepts for comparison. This method assists as a valuable tool for validating dataset quality for potential comparisons and determining feasibility for further analysis (Figure 1).
Figure 1. Boxplot Indicates the Datasets of Contrasts are Comparable.
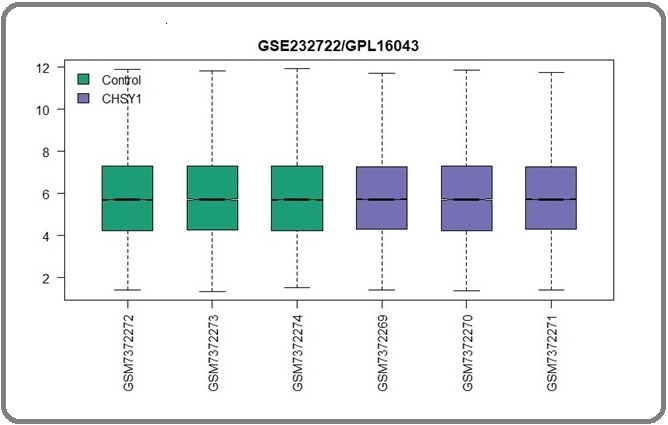
In this comparison, the range of data is shown and it can be interpreted from this comparison that the samples are similar. There are no outliers in this visualization and the plot is median centered. Another visualization method utilized in this study was the mean-difference plot, which visualizes variability in terms of regulatory nature. Down-regulation is represented by blue dots, while up-regulation is denoted by red dots (Figure 2).
Figure 2. Mean Difference Plotting, Each Point in the Plot Plotted by R Studio.
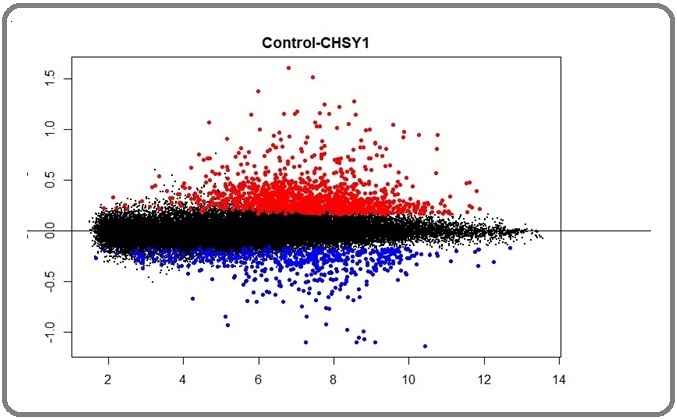
In mean difference plotting, every observation is vital for evaluating the agreement between two datasets. It demonstrates the reliability of gene expression data, with points closer to the horizontal line indicating insignificant variation in regulation nature. In other words, black dots signify negligible variation between the two contrasts. The farther the points are from the horizontal line, the more significant the data becomes.
To better understand the relationships of different sets of expressed genes, Venn diagram is used in Figure 3.
Figure 3. Venn Diagram Shows the Overlap between Two Groups of Expression Dataset in Terms of Significancy.
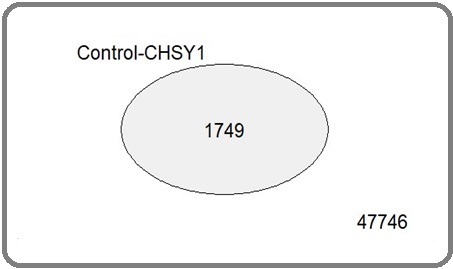
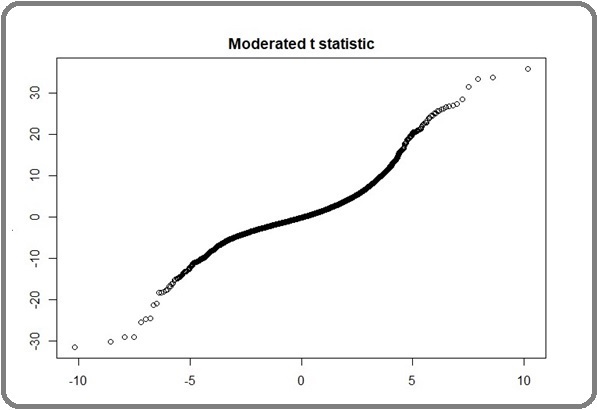
The 1749 genes in this study exhibit statistical significance regarding differences in expression. Moderated t-statistics are used to evaluate the reliability of limma test outcomes. Alignment of data points with the straight line may suggest accurate predictions (Figure 4).
Figure 4. Moderated t Statistical Assessing the Quality of Limma Test Result. Alignment of points with the straight line could indicate the correct prediction.
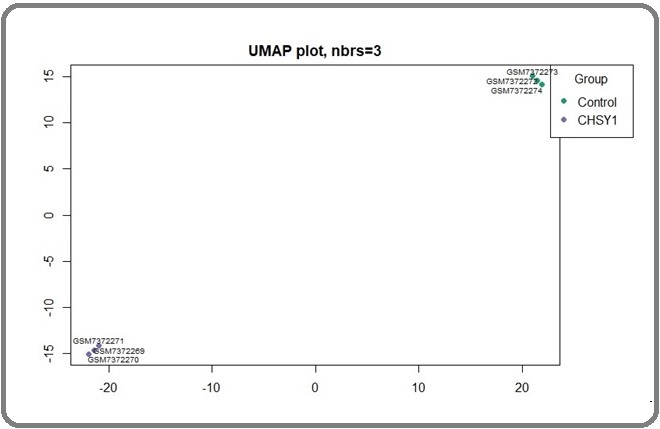
Utilizing UMAP for preprocessing the gene expression data aims to condense high-dimensional gene expression data into two or three dimensions. This facilitates the visualization of intricate patterns and relationships among samples (Figure 5).
Figure 5. U Map Plot Recognize the Dimension Reduction of Data.
A total of 1749 significant genes were chosen from the original study for further assessments, with a p-value adjusted to be less than 0.05. These identifiers were then queried in Cytoscape, resulting in a total of 1075 nodes and 5416 connections with a confidence score cutoff of 0.4. In the scatter plot (Figure 6) only a few nodes are situated at the far end of the plot, indicating a lower number of nodes with high values of both degree and betweenness centrality.
Figure 6. Blue Dots Depict the Distribution of Degree Values Versus Betweenness Centrality of Nodes.
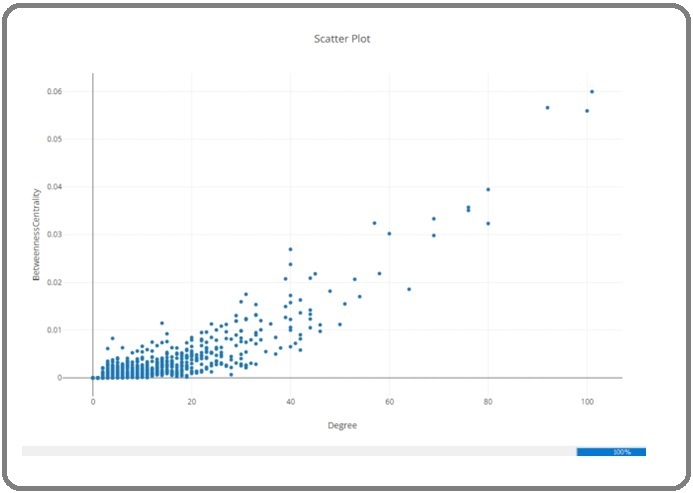
This observation suggests a scale-free network and confirms the existence of hubs and bottlenecks within the network. Hub-bottlenecks, Hub-non bottlenecks, and non Hub-bottlenecks are examined in this study for evaluation the central genes of the PPI network. For this mean, the most promising ones for further analysis are listed in Table 1.
| Row | Display name | Degree | BC | Statues |
| 1 | PTEN | 101 | 0.06 | UP |
| 2 | STAT3 | 100 | 0.06 | UP |
| 3 | BRCA1 | 92 | 0.06 | UP |
| 4 | CCND1 | 80 | 0.03 | UP |
| 5 | HIST1H4I | 80 | 0.04 | UP |
| 6 | EZH2 | 76 | 0.04 | UP |
| 7 | CREBBP | 76 | 0.04 | UP |
| 8 | MDM2 | 69 | 0.03 | Down |
| 9 | CAV1 | 69 | 0.03 | Down |
| 10 | FOS | 64 | 0.02 | UP |
| 11 | TFRC | 60 | 0.03 | Down |
| 12 | KAT2B | 58 | 0.02 | Up |
| 13 | APP | 57 | 0.03 | Down |
| 14 | NOTCH1 | 54 | 0.02 | Down |
| 15 | TARDBP | 53 | 0.02 | Down |
| 16 | SRSF1 | 51 | 0.02 | UP |
| 17 | CXCR4 | 50 | 0.01 | UP |
At first 54 genes were selected as the 5% top degree valued and then the number of genes were narrow down to the most significant ones. This narrow down was by considering a cut off of degree=50. PTEN has the highest value of degree= 101 versus CXCR4 has the lowest value equal to 50. As discernible from Figure 7, PTEN, identified as the highest-valued hub, stands out with a value of 101.
Figure 7. A Histogram Plot Depicting Degree Values, Incorporating a Regression Line. The x-axis represents degrees, while the y-axis displays the frequency of nodes corresponding to these values.
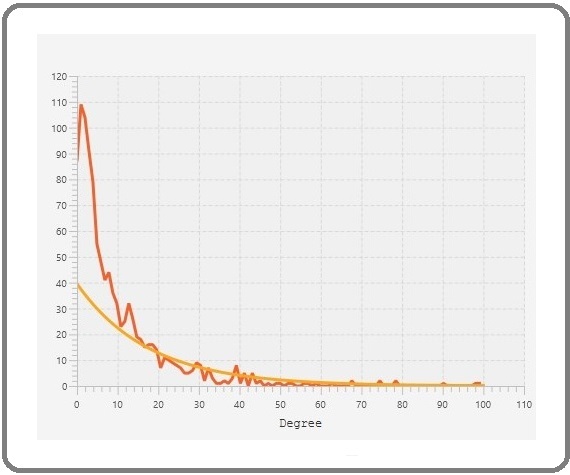
Moreover, the majority of nodes are located within the 0-10 degree range in this plot. For the enrichment investigation ClueGO+CluePedia were employed as a plug-ins in the Cytoscape for all DEGs. We incorporated gene annotation from three ontologies: cellular component, molecular function, and biological processes, into our analysis (see figure8).
Figure 8. A, Groups of Biological Processes; B, Cellular Component; and C, Molecular Function, p<0.01, kappa score ≤0.5.
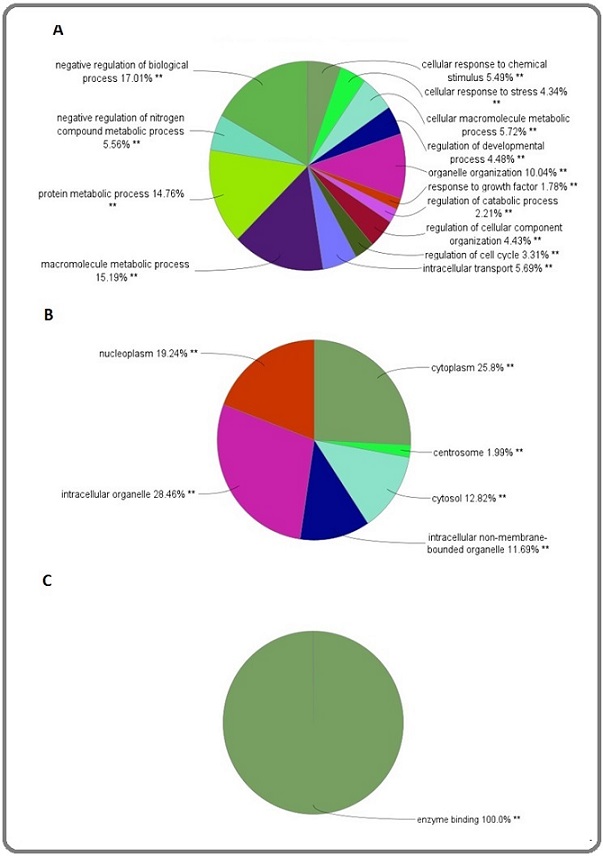
The pie chart views of three fundamental categories of gene ontology were interpreted by this examination.
Discussion
The significance of this study lies in gaining a deeper understanding of the impact of CHSY1 knockdown on the gene expression profile of ovarian cancer. Given the indispensable role of this gene in cancer progression and tumorigenesis, elucidating its effects is of utmost importance. For this study, ovarian cancer cells were transfected with shRNA targeting CHSY1, sourced from the GEO platform. GEO was the resource for this analysis with its online tool GEO2R and R programming approach. The comparison was handled by GEO2R of two groups of samples including control and CHSY1 knockdown. The analysis was further obtained as R script for R analysis purposes. Within R Studio, data comparison yielded visual interpretations in the form of boxplots, Venn diagrams, UMAP, and moderated t-statistics (Figures 1-5). Appling the mentioned methods to analyze data is descripted in details in literature [9-11]. Moreover, other statistical methods including, t-test, Anova, Multiple Testing Correction (Benjamini-Hochbergto control false discovery rate), and Log2 Transformation were employed to compare the experimental conditions and the results were also provided in R software. As previously mentioned, data visualization was utilized to enhance our understanding of gene expression and its complexity. Box plots were instrumental in identifying data preprocessing steps, ensuring the comparability of samples. The analysis of the box plots confirmed that all samples in this dataset are suitable for further analysis. Based on mean difference plotting, there are differentially expressed genes present in this dataset and there are either up-regulated or down-regulated. Similar interpretation can be obtained from Venn diagram in another form of visualization. This plot provides the total number of DEGs in our dataset which is 1749 DEGs. This visualization format assists our analysis to realize how many genes are to be inquired in the Cytoscape. The other plots (Moderated t statistical and UMAP) provide additional information which are regards to reliability of statistical test applied and the dimensionality reduction and simplification of dataset, respectively. After querying DEGs for PPI network analysis, a network of genes with physical interactions [12] was obtained. However, not all the genes were present in the network and in other words some remined as individual nodes. The network was then subjected to centrality analysis with respect to identifying hub and bottlenecks. The hubs and bottlenecks of our designed network are those nodes with high value of degree and betweenness centrality, respectively [13, 14]. Reviewing the literature could provide valuable insights into the role of these genes in ovarian cancer and shed light on how the knockdown of CHSY1 might impact them. Starting with the most valuable gene in the network also known as hub-bottleneck gene, PTEN up-regulation was detected in the control samples. Based on previous studies this gene is down-regulated in ovarian cancer that is responsible for expression of receptors of hormones [15]. It seems that this knockdown can influence the expression changes of PTEN and its regulation which is an important biomarker in ovarian cancer. The next hub-bottleneck is STAT3 which previous studies in ovarian cancer, reports its elevations in this type of cancer [16]. This gene is also has been a target for cancer studies for target therapy via inhibition approaches. The activation of this gene results in progression in metastasis [16]. This information implies that knockdown of CHSY1 have beneficial effects in reducing tumorigenesis, it could lead to the down-regulation of certain genes like STAT3, which is also implicated in ovarian cancer development. The mutation of BRCA1 has been reported in several studies [16]. In addition, in terms of expression, this gene is decreased in ovarian cancer [17]. In the knockdown procedure, there’s a decrease in the expression level of this gene, potentially leading to a negative impact on reducing cancer development.
The next gene, CCND1 that its expression is decreased in the knockdown samples, identified as a cancer promoting gene in ovarian cancer [18]. The decreased expression could inhibit tumor progression. HIST1H4I is the last gene in the list that we review, this gene also shows up-regulation in the control samples but not much of the previous information about its relationship with ovarian cancer is presented. In addition, numerous processes are associated with our differentially expressed genes (DEGs), as revealed by this analysis. Moreover, we’ve pinpointed the locations of these DEGs and highlighted the significant functions related to these genes. Overall, these alterations may be attributed to gene regulation and compensation phenomena.
Several essential biological processes are shown in various types of cellular components with enzymatic activity (Figure 8). It can be concluded that vial cellular functions are associated to the central nodes. This finding is corresponded to powerful ability of CHSY1 knockdown to prevent ovarian cancer progression.
In conclusion, the impact of CHSY1 knockdown extends beyond mere alterations in sets of gene expression levels. It also influences crucial genes with heightened centrality within a PPI network. It can be inferred that the up-regulation of CHSY1 in ovarian cancer may potentially contribute to the dysregulation of central genes, initiating tumorigenesis processes and exacerbating patient outcomes. Moreover, a compensatory effect was observed in certain central DEGs to prevent metastasis and tumor development.
Acknowledgments
Statement of Transparency and Principals:
• Author declares no conflict of interest
• Study was approved by Research Ethic Committee of author affiliated Institute.
• Study’s data is available upon a reasonable request.
• All authors have contributed to implementation of this research.
References
- CHSY1 promotes the tumorigenesis and progression of ovarian cancer. Running title:CHSY1 in ovarian cance Huang J, Feng Q, Wu H, Xia SS , Wang L, Xia L. 2023. CrossRef
- CHSY1 promotes CD8+ T cell exhaustion through activation of succinate metabolism pathway leading to colorectal cancer liver metastasis based on CRISPR/Cas9 screening Sun G, Zhao S, Fan Z, Wang Y, Liu H, Cao H, Sun G, et al . Journal of experimental & clinical cancer research: CR.2023;42(1). CrossRef
- Cancer Chemo-Preventive Effects of Red Propolis: a System Biology Approach Vafaee R, Zamanian Azodi M, Rezaei-Tavirani* M, Razzaghi Z, Arjmand B, Esmaeili S. Research Journal of Pharmacognosy.2023;10(1). CrossRef
- Towards a structurally resolved human protein interaction network Burke DF , Bryant P, Barrio-Hernandez I, Memon D, Pozzati G, Shenoy A, Zhu W, et al . Nature Structural & Molecular Biology.2023;30(2). CrossRef
- Cytoscape: software for visualization and analysis of biological networks Kohl M, Wiese S, Warscheid B. Methods in Molecular Biology (Clifton, N.J.).2011;696. CrossRef
- Identification of Essential Cancer Protein in PPI Network Using Graph-Based Approach Rout T, Choudhury NRR , Panda SK , Mohapatra A, Kar M, Muduly D. 2023 IEEE 11th Region 10 Humanitarian Technology Conference (R10-HTC).2023.
- Targeting colon cancer via antimicrobial RT2 peptide: a system biology study Hosseinpour Z, Zamanian Azodi M, Jahani Sherafat S, Rezaei Tavirani M. Gastroenterology and Hepatology From Bed to Bench.2023;16(4). CrossRef
- CluePedia Cytoscape plugin: pathway insights using integrated experimental and in silico data Bindea G, Galon J, Mlecnik B. Bioinformatics (Oxford, England).2013;29(5). CrossRef
- Dimensionality reduction by UMAP reinforces sample heterogeneity analysis in bulk transcriptomic data Yang Y, Sun H, Zhang Y, Zhang T, Gong J, Wei Y, Duan Y, et al . Cell Reports.2021;36(4). CrossRef
- TNMplot.com: A Web Tool for the Comparison of Gene Expression in Normal, Tumor and Metastatic Tissues Bartha Á, Győrffy B. International Journal of Molecular Sciences.2021;22(5). CrossRef
- Venn diagram analysis overestimates the extent of circadian rhythm reprogramming Pelikan A, Herzel H, Kramer A, Ananthasubramaniam B. The FEBS journal.2022;289(21). CrossRef
- Protein-protein interaction networks (PPI) and complex diseases Safari-Alighiarloo N, Taghizadeh M, Rezaei-Tavirani M, Goliaei B, Peyvandi AA . Gastroenterology and Hepatology from Bed to Bench.2014;7(1).
- A systematic survey of centrality measures for protein-protein interaction networks Ashtiani M, Salehzadeh-Yazdi A, Razaghi-Moghadam Z, Hennig H, Wolkenhauer O, Mirzaie M, Jafari M. BMC systems biology.2018;12(1). CrossRef
- Differential variation patterns between hubs and bottlenecks in human protein-protein interaction networks Pang E, Hao Y, Sun Y, Lin K. BMC evolutionary biology.2016;16(1). CrossRef
- Clinical and pathological associations of PTEN expression in ovarian cancer: a multicentre study from the Ovarian Tumour Tissue Analysis Consortium Martins FC , Couturier D, Paterson A, Karnezis AN , Chow C, Nazeran TM , Odunsi A, et al . British Journal of Cancer.2020;123(5). CrossRef
- Inhibition of constitutively active Stat3 suppresses growth of human ovarian and breast cancer cells Burke W. M., Jin X., Lin H. J., Huang M., Liu R., Reynolds R. K., Lin J.. Oncogene.2001;20(55). CrossRef
- Reduction of BRCA1 expression in sporadic ovarian cancer Zheng W., Luo F., Lu J. J., Baltayan A., Press M. F., Zhang Z. F., Pike M. C.. Gynecologic Oncology.2000;76(3). CrossRef
- Expression and clinical significance of CCND1 and MMP9 in ovarian cancer tissues Guanghui W, Jianxiang C, Wensheng D. U., Meizhen Y. a. O., Lei H. U. A.. Journal of Xuzhou Medical University.2023;43(8). CrossRef
License

This work is licensed under a Creative Commons Attribution-NonCommercial 4.0 International License.
Copyright
© Asian Pacific Journal of Cancer Biology , 2024
Author Details