Identification of Tumor Microenvironment Genes in Triple Negative Breast Cancer
Download
Abstract
Introduction: In triple negative breast cancer (TNBC) an aggressive molecular subtype of breast cancer, tumor microenvironment (TME) is a complex and dynamic ecosystem that plays a pivotal role in the tumor growth, disease metastasis, immune escape and therapeutic resistance. Understanding the TME holds significant potential for identification of biomarkers of TME and pathways associated as therapeutic targets for improving survival in patients with TNBC.
Materials and Methods: The current study evaluated 682 TME related genes by Array Comparative Genomic Hybridization (aCGH) in 55 patients with TNBC.
Results: Gain/amplification of 411 genes and loss/deletion of 196 genes of tumor microenvironment was observed in TNBC. Further PPI network analysis using Cytoscape plugin and degree ranking method identified GNAQ, MAPK1, AKT1, HRAS, and MAPK3 are five key up-regulated hub genes, and IL4, LCK, STAT6, MTOR, and NFKBIA are five key down-regulated hub genes.
Conclusion: Gain/amplification of GNAQ and loss/deletion of LCK leads to activation of PI3K/AKT/mTOR and RAS/MEK pathways which can be targeted to improve survival of patients with TNBC. However, validation of these pathway genes by RT-PCR or protein expression by immunohistochemistry are further needed to establish these biomarkers as therapeutic targets for TNBC.
Introduction
Triple-negative breast cancer (TNBC), which accounts for approximately 15-20% of all breast cancers, defined as lack of expression of estrogen receptor, progesterone receptor and Her-2 neu receptors and considered as an aggressive subtype of breast cancer. The tumor microenvironment (TME) in TNBC plays a crucial role in the initiation, progression, immune evasion, treatment resistance and prognosis by offering an environment conducive to the growth and proliferation of tumor cells. Tumor cell survival and proliferation supported by different types of cells were identified in the microenvironment, including stromal cells, fibroblasts, fat cells, vascular endothelial cells, and immune cells such as T lymphocytes, B lymphocytes, NK cells, tumor-associated macrophages, and extracellular matrix (ECM) components [1]. Most of these cells can secrete cytokines and play a role in promoting or inhibiting tumors. Among them, mesenchymal cells and fibroblasts can secrete growth factors such as hepatocyte growth factor, fibroblast growth factor, vascular endothelial growth factor (VEGF), metal secretory proteins MMP2 and CXCL12, and chemokines in the tumor microenvironment. The cytokines not only promote the growth and survival of tumor cells but also invasion and metastasis of tumor cells [2]. Through the recruitment of endothelial progenitor cells and the production of angiogenic factors such as VEGF, TME orchestrates angiogenic processes in TNBC [3]. The TME contributes to therapeutic resistance to chemotherapy and other treatments in TNBC and developing tailored cancer therapeutics requires an understanding of the TME’s various components and interconnections. Strategies that focus on particular TME components are being investigated as a means of enhancing treatment results and overcoming cancer therapy resistance [4].
In view of this knowledge, the present study aimed to identify TME related genes (biomarkers) in TNBC by Array Comparative Genomic Hybridization (aCGH) that may improve prognosis and provide additional insight into the tumor immune suppressive mechanism toward developing more effective therapies for TNBC.
Materials and Methods
Patients
This retrospective study included a total of 55 patients with Triple Negative breast cancer (TNBC: ER-PR- Her2-) diagnosed at The Gujarat Cancer and Research Institute (EC/13/2018). ER, PR and Her2/neu receptor status was evaluated by immunohistochemistry on Ventana Benchmark XT autostainer using commercially available respective Ventana rabbit monoclonal antibodies (ER clone SP1, PR clone 1E2, Her2 Clone 4B5). The formalin fixed paraffin embedded (FFPE) tissue samples of the TNBC patients were collected from the tissue repository of the institute. The primary treatment given to the patients was surgery followed by adjuvant chemotherapy. These patients were followed for a period of five years and disease status was recorded. Of 55 patients, 9 patients were undergone disease remission and 46 patients developed disease relapse (bone metastases N=1, brain metastases N=3, lung metastases N=12, liver metastases N=7, local recurrence N=8, ovarian metastases N=2, multiple metastases N=13). The FFPE samples were later subjected to aCGH work flow preceded by isolation of nucleic acids using Qiagen FFPE kit for DNA (As per manufacture’s protocol) for aCGH and Transcriptome studies, respectively.
Comparative genomic hybridization
In this study, 10 sections of 5 µm each were cut and total genomic DNA was isolated from Qiagen DNeasy tissue kit in Qiacube HT as per manufacturer’s instructions. Quantitative analysis of the isolated genomic DNA samples was determined using Qubit 3 (Invitrogen). Agilent two color microarray base comparative genomic hybridization analysis was used for the study. A total of 1000 ng FFPE extracted DNA was subjected to aCGH workflow. The reference DNA was subjected to heat fragmentation at 95oC for 10 min in a thermal cycler. Afterward, the sample and the reference DNA were put through labelling step. The labelling was performed using Cyanine 3 for reference DNA and Cyanine 5 for sample DNA using ULS labelling kit. Both the samples were transferred to thermal cycler under following condition; 85oC for 30 min, 4oC for 3 min. Labelled gDNA were purified for excess dye removal using Agilent KREA pure columns. Qualitative analysis for the purified labelled DNA was done using multimode plate reader (Varioskan Lux, Thermoscientific) and yield and specific activity of the sample were also calculated. Microarray hybridization was carried out by preparing hybridization sample mixture (Cot1 DNA, aCGH blocking agent, hybridization buffer and pooled sample). The sample mix was incubated at 95oC for 3 min and 37oC for 30 min on heat block and then added aCGH block at 37oC. The samples were loaded onto the gasket slide using Sure print G3 Human CGH Microarray 4X180K slide for hybridization (Maintained at constant 37oC) in Hybridization oven at 65oC for 40 hours. Then microarray slide was washed using wash buffers (Agilent) and scanned in microarray scanner (Agilent Sure Scan Microarray scanner). The scanned slides were analysed by uploading the. tif image in to Agilent Cytogenomics Software. Then the up-regulated and down-regulated genes were subjected to GeneCodis 4 software to obtain significantly expressed genes, and these data were imported through STRING network in Cytoscape software for protein-protein interaction network analysis (PPI Network). The data from the STRING analysis were analyzed by Cytohubba plugin and identified top 5 genes using degree ranking method.
Results
Amplification/gain of genes of tumor microenvironment using aCGH in TNBC:
Atotal of 682 genes involved in tumor microenvironment were studied using aCGH in 55 patients with TNBC. It was observed that gain/amplification of 411 genes and loss/ deletion of 196 genes of tumor microenvironment in TNBC patients.
PPI network analysis
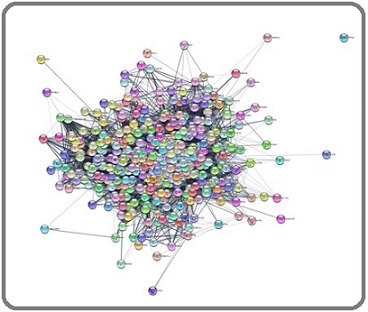
Further gain/amplification of genes and loss/deletion of genes were entered in GeneCodis-4 software to obtain significantly expressed genes, and this data were imported in Cytoscape software for PPI network analysis. The PPI network analysis of up-regulated genes generated with interaction of 399 nodes including 570 edges (Figure 1).
Figure 1. Main Connected Component of Protein-protein Interaction Network of Upregulated Genes in TNBC. The Component Includes 399 Nodes Including 570 Edges.
Identification of top upregulated and downregulated hub genes:
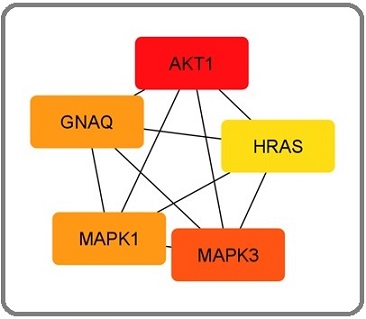
GNAQ, MAPK1, AKT1, HRAS, and MAPK3 are five key up-regulated hub genes identified according to degree ranking method (Table 1, Figure 2a).
| Up regulated genes | Down-regulated genes | |||||
| Rank | Hub genes | Chromosome Location | Cyto-band | Hub genes | Chromosome Location | Cyto-band |
| 1 | GNAQ | 9 | hs 9q21.2 | IL4 | 5 | hs 5q31.1 |
| 2 | HRAS | 11 | hs 11p15.5 | LCK | 1 | hs 1p34.1 |
| 3 | MAPK1 | 22 | hs 22q11.22 | STAT6 | 12 | hs 12q13 |
| 4 | AKT1 | 14 | hs 14q32.32 | MTOR | 1 | hs 1p36.22 |
| 5 | MAPK3 | 16 | hs 16p11.2 | NFKBIA | 12 | hs 14p13.2 |
Figure 2. Top 5 Upregulated Hub Genes Identified by CytoHubba Cytoscape Plugin. Genes with the highest number of connections in the network are detected as hub genes. The image shows the degree of importance of hubs through a color scale ranging from red (the most important) to yellow (less important).
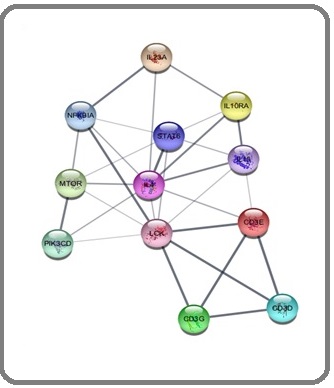
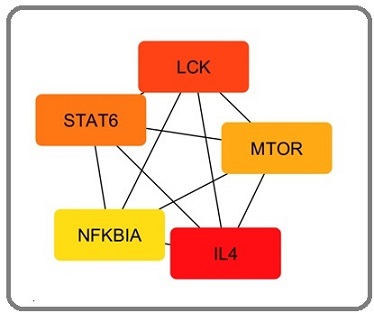
Further, the PPI network analysis of down-regulated genes generated with interaction of 12 nodes including 29 edges (Figure 3).
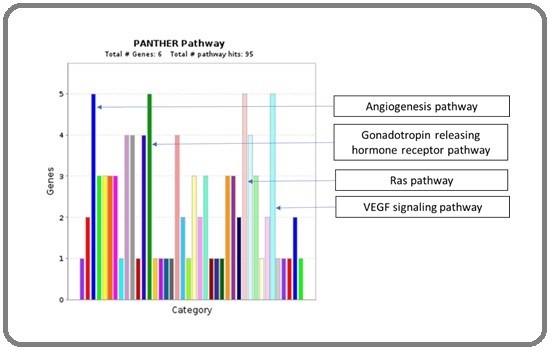
Figure 3. Identification of Major Pathways Involved with up Regulated Hub Genes by Panther Pathway Analysis.
IL4, LCK, STAT6, MTOR, and NFKBIA are five key down-regulated hub genes identified according to degree ranking method (Table 1, Figure 4).
Figure 4. Main Connected Component of Protein-protein Interaction Network of Downregulated Genes in TNBC. The component includes 12 nodes including 29 edges.
Identification of
For the identification of the major pathway involvement, all five upregulated hub genes GNAQ, MAPK1, AKT1, HRAS, and MAPK3 were entered in Panther Pathway tool for the analysis. This analysis identified total 95 functional hits involving the following pathways. Four major involved pathways are angiogenesis pathway, gonadotropin releasing hormone receptor signaling pathway, Ras pathway, and VEGF signaling pathway (Figure 5).
Figure 5. Top 5 Down Regulated Hub Genes Identified by CytoHubba Cytoscape Plugin. Genes with the highest number of connections in the network are detected as hub genes. The image shows the degree of importance of hubs through a color scale ranging from red (the most important) to yellow (less important).
Identification of major pathways involving top down regulated hub genes by Panther Pathway Analysis:
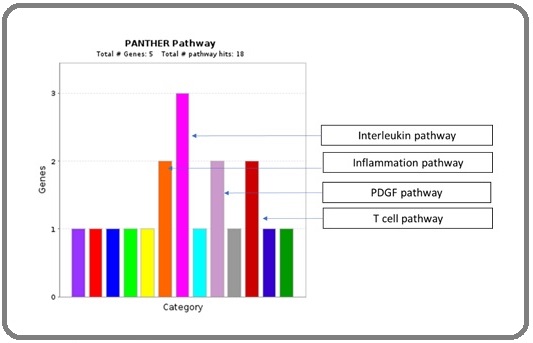
For the identification of the major pathway involvement, all five down regulated hub gene were entered in Panther Pathway tool for the analysis. This analysis identified total 18 functional hits involving the following pathways. Four majorly involved pathways are inflammation pathway, interleukin pathway, PDGF pathway and T cell pathway (Figure 6).
Figure 6. Identification of Major Pathways Involved with Down Regulated Hub Genes by Panther Pathway Analysis.
Correlation of gain/amplification of gene expression with clinical and pathological parameters:
Gain/amplification of genes when correlated with clinical and pathological parameters, AKT gene exhibited significant association with disease stage and HRAS gene exhibited significant association with histologic grade of the tumors. Patients with stage III disease had higher incidence of gain/amplification of AKT gene than patients with stage I or II disease. Patients with histologic grade II tumors had a significant higher incidence of HRAS gene followed by grade III and grade I tumors. A similar trend was seen of with gain/amplification of MAPK1, MAPK3 and GNAQ genes with histologic grade. Similarly gain/amplification of HRAS gene exhibited significant association with BR Score of the tumors. Intermediate and high BR Score tumors had a higher incidence of gain/amplification of HRAS gene as compared to BR Score I tumors. A similar trend was seen of with gain/amplification of MAPK1, MAPK3, HRAS and GNAQ genes with BR Score of the tumor. With other clinicopathological parameters and disease metastasis, gain/amplification of genes expression did not show significant correlation analysis (Table 2).
| GNAQ gene | AKT gene | HRAS gene | MAPK1 gene | MAPK3 gene | ||
| Parameters | N (%) | gain/amp | gain/amp | gain/amp | gain/amp | gain/amp |
| N (%) | N (%) | N (%) | N (%) | N (%) | ||
| Age in years | ||||||
| ≤47 | 32 (58) | 29 (91) | 30 (94) | 31 (97) | 30 (94) | 30 (94) |
| >47 | 23 (42) | 20 (87) | 21 (91) | 22 (96) | 20 (87) | 21 (91) |
| Menopausal Status | ||||||
| Pre-menopausal | 19 (35) | 17 (90) | 17 (90) | 18 (95) | 18 (95) | 18 (95) |
| Post-menopausal | 36 (65) | 32 (89) | 34 (94) | 35 (97) | 32 (89) | 33 (92) |
| Tumor Size | ||||||
| T1+ T2 | 38 (69) | 33 (87) | 35 (92) | 36 (95) | 33 (87) | 34 (90) |
| T3+ T4 | 17 (31) | 16 (94) | 16 (94) | 17 (100) | 17 (100) | 17 (100) |
| Lymph Node | ||||||
| Negative | 11 (20) | 11 (100) | 09 (82) | 11 (100) | 10 (91) | 09 (82) |
| Positive | 44 (80) | 38 (86) | 42 (95) | 42 (95) | 40 (91) | 42 (95) |
| Disease Stage | ||||||
| I + II | 27 (51) | 25 (93) | 23 (85) a | 25 (93) | 23 (85) | 24 (89) |
| III | 28 (49) | 24 (86) | 28 (100) a | 28 (100) | 27 (96) | 27 (96) |
| Histologic Grade | ||||||
| I | 03 (06) | 02 (67) | 02 (67) b | 01 (33) c | 02 (67) | 02 (67) |
| II | 24 (44) | 22 (92) | 24 (100) b | 24 (100) c | 24 (100) | 24 (100) |
| III | 27 (50) | 24 (89) | 24 (89) b | 27 (100) c | 23 (85) | 24 (89) |
| BR Score | ||||||
| Low | 03 (06) | 02 (68) | 02 (68) | 01 (33)d | 02 (67) | 02 (67) |
| Intermediate | 20 (42) | 18 (90) | 19 (95) | 20 (100)d | 20 (100) | 20 (100) |
| High | 25 (52) | 22 (88) | 23 (92) | 25 (100)d | 22 (88) | 22 (88) |
| Local Recurrence / Metastasis | ||||||
| Absent | 09 (16) | 09 (100) | 09 (100) | 09 (100) | 08 (89) | 08 (89) |
| Present | 46 (84) | 40 (87) | 42 (91) | 44 (96) | 42 (91) | 43 (94) |
gain/amp = gain/amplification; aX2=4.47, r= 0.28, p=0.03; bX2=14.96, r=-0.38, p=0.004; cX2=35.30, r=-0.47, p=0.001; dX2=31.30, r=-0.49, p=0.001
Correlation of loss/deletion of gene expression with clinical and pathological parameters:
Loss/deletion of genes when correlated with clinicopathological parameters, loss/deletion of NFKBIA gene exhibited significant association with disease metastasis. A higher incidence loss/deletion of NFKBIA gene was seen in patients who developed disease relapse than patients who undergo disease remission. A similar trend was seen with loss/deletion of STAT6 gene with disease metastasis. With other clinicopathological parameters, loss/deletion of genes expression did not show significant correlation (Table 3).
| IL4 gene | LCK gene | STAT6 gene | mTOR gene | NFKBIA gene | ||
| Parameters | N (%) | loss/deletion | loss/deletion | loss/deletion | loss/deletion | loss/deletion |
| N (%) | N (%) | N (%) | N (%) | N (%) | ||
| Age in Years | ||||||
| ≤47 | 32 (58) | 25 (78) | 27 (84) | 27 (84) | 25 (78) | 28 (87) |
| >47 | 23 (42) | 18 (78) | 18 (78) | 22 (96) | 19 (83) | 20 (87) |
| Menopausal Status | ||||||
| Pre-menopausal | 19 (35) | 15 (79) | 15 (79) | 16 (84) | 16 (84) | 17 (90) |
| Post-menopausal | 36 (65) | 28 (78) | 30 (83) | 33 (92) | 28 (78) | 31 (86) |
| Tumor Size | ||||||
| T1+ T2 | 38 (69) | 32 (84) | 33 (87) | 35 (92) | 31 (82) | 34 (90) |
| T3+ T4 | 17 (31) | 11 (65) | 12 (71) | 14 (82) | 13 (76) | 14 (82) |
| Lymph Node | ||||||
| Negative | 11 (20) | 09 (82) | 08 (73) | 11 (100) | 08 (73) | 09 (82) |
| Positive | 44 (80) | 34 (78) | 37 (84) | 38 (86) | 36 (82) | 39 (89) |
| Disease Stage | ||||||
| I + II | 27 (49) | 23 (85) | 21 (78) | 25 (93) | 21(78) | 24 (89) |
| III | 28 (51) | 20 (71) | 24 (86) | 24 (86) | 23 (82) | 24 (86) |
| Histologic Grade | ||||||
| I | 03 (06) | 02 (67) | 02 (67) | 01 (33) | 02 (67) | 02 (67) |
| II | 24 (44) | 20 (83) | 22 (92) | 23 (96) | 22 (92) | 23 (96) |
| III | 27 (50) | 20 (74) | 20 (74) | 24 (89) | 19 (70) | 22 (82) |
| BR Score | ||||||
| Low | 03 (06) | 02 (67) | 02 (67) | 01 (33) | 02 (67) | 02 (67) |
| Intermediate | 20 (42) | 14 (70) | 16 (80) | 19 (95) | 17 (85) | 18 (90) |
| High | 25 (52) | 20 (80) | 21 (84) | 22 (88) | 19 (76) | 21 (84) |
| Local Recurrence / Metastasis | ||||||
| Absent | 09 (16) | 07 (78) | 08 (89) | 07 (78) | 06 (67) | 06 (67) a |
| Present | 46 (84) | 36 (78) | 37 (80) | 42 (91) | 38 (83) | 42 (91) a |
a X2=4.11, r= -0.27, p=0.04
Discussion
In this study, 682 genes involved in tumor microenvironment were studied using aCGH and identified gain/amplification of 411 genes and loss/ deletion of 196 genes in TNBC. PPI analysis revealed 399 nodes interacted with a total of 570 edges. Using the degree ranking method, the top five upregulated genes GNAQ, HRAS, MAPK1, AKT1, and MAPK3 were identified as hub genes. The GNAQ gene codes for a protein named guanine nucleotide-binding protein G (q) subunit alpha (Gαq). The Gαq protein belongs to a group of proteins called the trimeric G protein complex. Under normal circumstances, G protein complexes bind to receptors known as G protein coupled receptors, and after that Gαq protein binds to GTP, cause activation of GTP and thereby activation of signaling pathways that aid in controlling blood vessel formation and function. Then Gαq protein converts GTP to a similar molecule called GDP, which inactivates the protein and reattaches to the trimeric G protein complex to turn off signaling pathways. In disease condition, altered Gαq protein cannot convert GTP to GDP. As a result, the protein and thereby signaling pathways remain constitutively active leads to abnormal and excessive formation of vessels. GNAQ can activate PI3K/AKT/mTOR pathway, MAPK pathway, and NFkB or activate non-canonical Hippo signaling through Rho/Rac in human cancers. There are no studies available regarding role of GNAQ in breast cancer. In gastric cancer patients, high GNAQ protein expression was associated with younger age and advance histological grade. The silencing of GNAQ resulted via lentivirus delivery of short hairpin RNA (shRNA) targeting GNAQ, which significantly reduced gastric cancer cell proliferation and colony formation, and arrest the cell cycle at the S phase. The expression of p53 and p21 was markedly enhanced upon GNAQ knockdown, with a decrease in cyclin A and p-CDK2 protein and decrease in phosphorylation of ERK and MEK. These results suggested GNAQ as a potential therapeutic target for gastric cancer [5]. Recurrent GNAQ T96S mutations were detected in Natural Killer/T Cell Lymphoma [6]. AKT1 gene, also known as AKT Serine/ Threonine Kinase 1, is a protein-coding gene that plays a crucial role in various cellular processes such as cell proliferation and angiogenesis. A significant higher incidence of gain/amplification of AKT1 gene was observed in patients with advanced disease stage and high grade tumors in the present study and in a study on prostate cancer [7]. In a study by Lin FM et al. [8] genomic alterations were found in the cell cycle, p53, PI3K/mTOR, RAS/MAPK, and RTK/GF signaling pathways in TNBC, and among them AKT/mTOR/PI3K pathway mutations were the most prevalent genetic alterations. Additional investigation was carried out to pinpoint pivotal genes in the PI3K/AKT/mTOR pathway that were responsible for the unique expression pattern. AKT3, GSK3B (glycogen synthase kinase-3 beta), PI3KR1 (phosphoinositide-3- kinase regulatory subunit 1), GNAQ (G protein subunit alpha Q), and GNA11 (G protein subunit alpha 11) were the genes with the highest statistical significance among all the differentially expressed genes. Using the mRNA expression dataset of TNBC, Lin FM et al. [8] also observed that elevated expression of AKT3, GNA11, and GNAQ was linked to a trend of shorter disease free survival. Regarding HRAS gene, involved in regulating cell division in response to growth factor stimulation and one of the stimulator of PI3K-AKT pathway. The present study and study on small cell lung cancer observed significant gain/amplification of HRAS gene in patients with advanced histopathological grade and advanced BR score [9, 10].
MAPK1 and MAPK3, also known as ERK2 and ERK1, respectively, are members of the mitogen-activated protein kinase (MAPK) family, which transduce signals from growth factors. This current study did not observe any association of gain/amplification of MAPK1 and MAPK3 with clinical and pathological parameters. However, a study by Bhatt et al found that MAPK3, MAPK1, and MAPK7 gene expression correlated with EMT markers and poor overall survival in breast cancer patients using publicly available datasets [11]. The MAPK1 gene has also been shown to promote metastasis and invasion in gastric cancer as a bidirectional transcription factor [12]. MAPK3 is associated with the initiation, development, metastasis, drug resistance, and poor prognosis in malignancies like glioma, liver, ovarian, thyroid, lung, breast, gastric, and oral cavity [13].
Furthermore, loss/deletion of 196 genes associated with tumor microenvironment was observed in present study. PPI network analysis further revealed that 12 nodes interacted with a total of 29 edges. Using the degree ranking method, the top five loss/deleted genes IL4, LCK, STAT6, mTOR, and NFKBIA were identified as hub genes. IL4 is a cytokine that plays a crucial role in the differentiation of T helper 2 (Th2) cells and the regulation of immune responses [14]. However, IL-4 is a double-edged sword: it has been reported to mediate an antitumor effect [15-17] and pro-tumor effect [18, 19]. Cancer cells also produce IL-4 and this cytokine functions as an activator of tumour-associated macrophages and myeloid-derived suppressor cells which mediate pro-tumour activity and create immunosuppressive tumor microenvironment leads to T cell dysfunction [18-21]. LCK is a tyrosine kinase that plays a critical role in T cell activation and differentiation. LCK is important in regulating the expression of IL-4 [22] and also involved in the activation of nuclear factor κB (NF-κB) [23]. Hence, loss/deletion of these genes suppress T cell antitumor immunity in tumor microenvironment and promote tumor development. Further the upregulated and downregulated hub genes need to be validated by RT-PCR or protein expression by immunohistochemistry and their correlation with survival.
In conclusion, 5 upregulated hub genes of TME cause activation of PI3K/AKT/mTOR and RAS/MEK pathways and 5 downregulated hub genes of TME cause immunosuppressive tumor microenvironment might be involved in aggressiveness of TNBC and become new candidate biomarkers for TNBC treatment. Further hub gene screening based on survival might be more clinically significant to establish these genes as therapeutic targets in TNBC.
Acknowledgments
Statement of Transparency and Principals:
• Author declares no conflict of interest
• Study was approved by Research Ethic Committee of author affiliated Institute.
• Study’s data is available upon a reasonable request.
• All authors have contributed to implementation of this research.
Funding Agency
Gujarat State Biotechnology Mission, Government of Gujarat, Gujarat, INDIA.
References
- The evolving tumor microenvironment: From cancer initiation to metastatic outgrowth Visser KE , Joyce JA . Cancer Cell.2023;41(3). CrossRef
- Role of the tumor microenvironment in PD-L1/PD-1-mediated tumor immune escape Jiang X, Wang J, Deng X, Xiong F, Ge J, Xiang B, Wu X, et al . Molecular Cancer.2019;18(1). CrossRef
- Tumor microenvironment: Challenges and opportunities in targeting metastasis of triple negative breast cancer Deepak K. G. K., Vempati R, Nagaraju GP , Dasari VR , S N, Rao D. N., Malla RR . Pharmacological Research.2020;153. CrossRef
- Extracellular Matrix in the Tumor Microenvironment and Its Impact on Cancer Therapy Henke E, Nandigama R, Ergün S. Frontiers in Molecular Biosciences.2020;6. CrossRef
- G protein subunit α q regulates gastric cancer growth via the p53/p21 and MEK/ERK pathways Wang Y, Xiao H, Wu H, Yao C, He H, Wang C, Li W. Oncology Reports.2017;37(4). CrossRef
- Recurrent GNAQ mutation encoding T96S in natural killer/T cell lymphoma Li Z, Zhang X, Xue W, Zhang Y, Li C, Song Y, Mei M, et al . Nature Communications.2019;10(1). CrossRef
- Genome atlas analysis based profiling of Akt pathway genes in the early and advanced human prostate cancer Alwhaibi A, Kolhe R, Gao F, Cobran EK , Somanath PR . Oncoscience.2019;6(5-6). CrossRef
- Differential gene expression and AKT targeting in triple negative breast cancer Lin F, Yost SE , Wen W, Frankel PH , Schmolze D, Chu P, Yuan Y, et al . Oncotarget.2019;10(43). CrossRef
- A clinically relevant gene signature in triple negative and basal-like breast cancer Rody A, Karn T, Liedtke C, Pusztai L, Ruckhaeberle E, Hanker L, Gaetje R, et al . Breast cancer research: BCR.2011;13(5). CrossRef
- Clinical significance of HRAS and KRAS genes expression in patients with non-small-cell lung cancer - preliminary findings Pązik M, Michalska K, Żebrowska-Nawrocka M, Zawadzka I, Łochowski M, Balcerczak E. BMC cancer.2021;21(1). CrossRef
- Diverse and converging roles of ERK1/2 and ERK5 pathways on mesenchymal to epithelial transition in breast cancer Bhatt AB , Wright TD , Barnes V, Chakrabarty S, Matossian MD , Lexner E, Ucar DA , et al . Translational Oncology.2021;14(6). CrossRef
- MAPK1 promotes the metastasis and invasion of gastric cancer as a bidirectional transcription factor Wang Y, Guo Z, Tian Y, Cong L, Zheng Y, Wu Z, et al . BMC cancer.2023;23(1). CrossRef
- Flavonoids as Strong Inhibitors of MAPK3: A Computational Drug Discovery Approach Taherkhani A, Khodadadi P, Samie L, Azadian Z, Bayat Z. International Journal of Analytical Chemistry.2023;2023. CrossRef
- Association of Interleukin-4 Polymorphisms With Breast Cancer in Taiwan Chu C, Wang Y, Chang W, Wang Z, Liu L, Wang S, Lin C, et al . In Vivo (Athens, Greece).2020;34(3). CrossRef
- Paracrine cytokine adjuvants in cancer immunotherapy Pardoll D. M.. Annual Review of Immunology.1995;13. CrossRef
- IL-4-transduced tumor cell vaccine induces immunoregulatory type 2 CD8 T lymphocytes that cure lung metastases upon adoptive transfer Rodolfo M., Zilocchi C., Accornero P., Cappetti B., Arioli I., Colombo M. P.. Journal of Immunology (Baltimore, Md.: 1950).1999;163(4).
- Murine interleukin-4 displays potent anti-tumor activity in vivo Tepper R. I., Pattengale P. K., Leder P.. Cell.1989;57(3). CrossRef
- Apoptosis resistance in epithelial tumors is mediated by tumor-cell-derived interleukin-4 Todaro M., Lombardo Y., Francipane M. G., Alea MP , Cammareri P., Iovino F., Di Stefano A. B., et al . Cell Death and Differentiation.2008;15(4). CrossRef
- Targeting of IL-4 and IL-13 receptors for cancer therapy Suzuki A, Leland P, Joshi BH , Puri RK . Cytokine.2015;75(1). CrossRef
- Cytokine stimulation of epithelial cancer cells: the similar and divergent functions of IL-4 and IL-13 Hallett MA , Venmar KT , Fingleton B. Cancer Research.2012;72(24). CrossRef
- Targeting IL4/IL4R for the treatment of epithelial cancer metastasis Bankaitis KV , Fingleton B. Clinical & Experimental Metastasis.2015;32(8). CrossRef
- Lck mediates Th2 differentiation through effects on T-bet and GATA-3 Kemp KL , Levin SD , Bryce PJ , Stein PL . Journal of Immunology (Baltimore, Md.: 1950).2010;184(8). CrossRef
- Blockade of Tyrosine Kinase, LCK Leads to Reduction in Airway Inflammation through Regulation of Pulmonary Th2/Treg Balance and Oxidative Stress in Cockroach Extract-Induced Mouse Model of Allergic Asthma Alqarni SA , Bineid A, Ahmad SF , Al-Harbi NO , Alqahtani F, Ibrahim KE , Ali N, Nadeem A. Metabolites.2022;12(9). CrossRef
License

This work is licensed under a Creative Commons Attribution-NonCommercial 4.0 International License.
Copyright
© Asian Pacific Journal of Cancer Biology , 2024
Author Details