Quantification of Main Bcr-abl Gene Transcripts in CML Patients Using Competitive RT-PCR
Download
Abstract
Chronic myelogenous leukemia (CML) is the outcome of a chromosomal translocation and abl and bcr genes fusion. The present study is an attempt to implement a simple and inexpensive method for quantification of bcr-abl fusion transcripts in CML patients. Competitive RT-PCR technique was used to quantify bcr-abl transcripts. Internal control DNA piece was designed and synthesized from a non-human source, which was smaller than the target DNA in length but with the end identical to the main target piece. Following proliferation and purification, the transcriptions were quantified. To optimize reaction condition, competitive PCR was first performed separately on the target DNA with a given number of copies and a given number of copies of internal controls and the result of the reaction was electrophoresed for all concentrations of agarose electrophoreses gel. Results of simultaneous reactions of target RNA along with different number of copies of internal controls showed that the number of target RNA copies can e determined through comparing intensity of the color of DNA bands on the gel. The results showed that comparing with other methods like Real-time, the competitive RT-PCR is a relatively efficient and economic method to quantify bcr-abl transcripts.
Introduction
Chronic myelogenous leukemia is a clonal disorder of hematopoietic stem cell that leads to an increase in myeloid, erythroid, and megakaryocyte cell lines in peripheral blood and an increase of hyperplasia myeloid in bone marrow. CML is associated with a cytogenetic disorder known as Philadelphia chromosome (Ph). The latter is a shorten chromosome 22 due to reciprocal translocation of t(9;22)(q34;199), which results in fusion of 3’ region of c-abl protooncogene (9q34) to 5’ region of bcr gene on 22qll chromosome. Variety of fused BCR-ABL protein are formed depending on breakpoint in BCR gene. Three major breakpoints including major-BCR (M-BCR), minor-BCR (m-BCR), and micro-BCR (µ-BCR) have been identified [1, 2].
More than 95% of the CMLs demonstrate breakpoint at M-BCR region. Two breakdowns occur at this region: one is after exon 13 (e13) that results in el3a2 fusion (b2a2) and another is after exon 14 (e14) that results in e14a2 (b3a2). Both of these fused mRNs are translated into a 210 kD protein (9210BCR-ABL) [3, 4] . This type of fused protein is found in 30% of acute lymphoblastic leukemia (ALL(. The rare cases of breakpoint in CML patients include m-BCR and µ-BCR. As to m-MBCR breakpoint, breakdown after exon 1 results in formation of ela2 fusion, and this fused mRNA is translated into 190 kD protein (p190BCR-ABL). The 190kD protein is found in 50-70% of ALL patients as well. Another rare breakpoint is (µ-BCR) that due to a breakdown at exon 19 (e19) leads to e19a2 fusion, which is then translated into 23kD protein. This type of breakpoint is more common in chronic neutrophilic leukemia (CNL). On the other hand, breakpoint in abl gene is relatively fixed and located before exon 2 (e2). This fusion is featured with increase in tyrosine kinase activity of bcr gene, which results in increase of cellular proliferation, attenuation of dependence on growth factor, apoptosis suppression, changes in adhesiveness and other side effects. Currently, cytogenetic and molecular methods are used to detect t(9;22) in patients whether at diagnosis, treatment, or recurrence stages. Chromosomes banding is of great importance is examining progress of the disease due to their high specificity and capability to diagnose excessive chromosomal disorders. However, cytogenetic analysis needs bone marrow cells with more than 10% of peripheral blood blasts. Number of the cells that can be examined determines sensitivity of karyotyping. On the other hand, factors such as fibrosis that disrupt in obtaining bone marrow through aspiration deduce cells count and sensitivity of the technique. At any rate, in 5% of CML cases, occurrence of t (9;22) is not diagnosable through cytogenetic analysis and it results in false negative karyotyping analysis [3, 5] Taking into account the resistance developed in cancerous cells to chemotherapy and high risk of recurrence after bone marrow transplant (HSCT), it is essential to examine minimum residual disease (MRD) after pharmaceutical therapy or transplant.
Treatment response can be measured in three ways including hematological, cytogenetic, and molecular methods. Hematological improvement indicators are blood cells count and spleen size; and cytogenetic response is measured based on rate of residual Ph+ cells. Treatment response can be measured using molecular methods as well.
Competitive RT-PCR method is one of the molecular methods to quantify transcripts during treatment or recurrence stages [1, 4, 5, 6, 7, 8, 9]. In addition to presence of the target DNA, the method is featured with internal control, which is a non-target sequence of DNA so that a primer sequence that is common with the target DNA is positioned on two sides of the internal control through composite primer technique. As a result, the two pieces of DNA are proliferated under identical condition and in a reaction medium. This method is featured with a continuous competition between the control piece and the internal control, so that proliferation of which is almost identical when the number of copies of the two pieces are equal. This feature is the foundation of competitive RT-PCR halving to measure number of copies. Internal control and number of its copies are determined through spectrophotometer of the gel after proliferation and purification. Through a competitive reaction, specific number of copies of the internal control are proliferated along with unknown target copies under identical condition [8].
Materials and Methods
CML cells
CML cells were obtained by culturing K562 cell line (containing Philadelphia chromosome with M-BCR breakpoint) at about 105cells/ml supplied from cell bank of Iran Pasteur Institute.
RNA extraction
Complete RNA was extracted from 50µL cell suspension condensed by RNA RNX extraction solution (Iran Sinagen Company) using completed blood and as per instruction of the supplier.
Proliferation of CML fused transcripts using RT-PCR
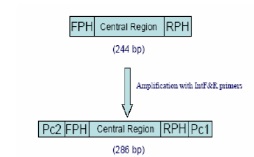
Following Martinelli.G et al [9]. RT-PCR reaction was performed, with small modification, in two steps on 5µl solution of the extracted RNA (0.1µg/µl). The first stage reaction was done in 20µl solution of RNA (1µg), KCL (90mmol/L), Tris HCL (100mmol/L) (pH8.3), MgCI (1.5mmol/L), dNTP (200mmol/L), RNasin 12 U, and pcl primer (10pmol), DMSO (10%), and M-Mulv Reverse Transcriptase (100 units) at 42ºC for 1hr. PCR reaction was completed using pc1 and pc2 in a 25µl solution containing the product of inverse transcription reaction (2µl), KCl (90mmol/L), Tris (100mmol/L), HCl (pH8.3), MgCI (1.5mmol/L), nucleotides (200mmol/L each), pc1 and pc2 primers (10 pmol), 1.5unit of Taq DNA polymerase at 95ºC for 30S, 61ºC, 72ºC for 30s, and 72ºC for 5min. afterward, the 416 base pairs product was electrophoresed on agarose gel (2%).To have a standard for quantification, a piece of DNA with 255 base pairs in length from non-human source (hepatitis C virus) was prepared and the end sequences of the target piece was placed on two ends of the DNA piece using PCR technique (Fig 1)
Figure 1 :A schematic view of internal control preparation process
Internal control piece
Design of the primers made sure that 3oC ward sequencing is complementary with two ends of control DNA piece and sequencing of two ends of target DNA is at 5 oC ward. After proliferation, one control DNA piece with 286 base pairs was prepared.
Purifying and determining number of internal control pieces
Following proliferation of DNA piece using PCR reaction, it was electrophoresed on agarose gel and DNA band was extracted. DNA extraction was done used KIA kit (KIA 190-Iran). Afterward, concentration of DNA was measured based on absorption at 260nm wavelength. Then the concentration figure was converted into molarity and number of copies was obtained as follows:
DNA molecule (1pm)= (concentration of DNA based on μg + 1515)/ number of open pairs Each mol of a molecule is Avogadro constant (about 6.02+1023)
Results
Specificity of diagnosing fused transcripts using RT-PCR
The result of RT-PCR proliferation was obtained using pc1 and pc2 primers on RNA extracted from K562 cells (Fig 2)
Figure 2 : row 1: RT-PCR reaction with 420 base pairs length; row 2: negative control; row 3: marker size 100 base pairs (Fermentas).
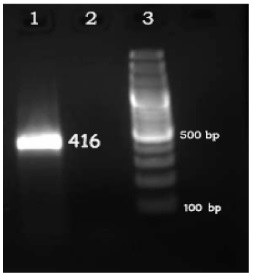
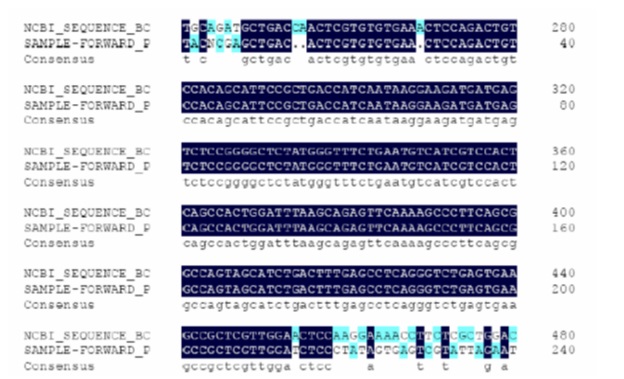
Sequencing of the piece with 416 base pairs was determined using pc2 primer (TAG-Denmark). Specificity of the proliferated sequence was compared with b3a2 RNA complete sequence in DNAMan and genuineness was confirmed (Fig. 3).
Figure 3 :Comparison of sequence of RT-PCR product with complete sequence of mRNA of bcr-abl transcript. The first row at the top represents sequence of bcr-abl transcript, the second row indicates sequenced sequence of RT-PCR product, and the third row represents identical nucleotide between them.
Quantification using Competitive RT-PCR
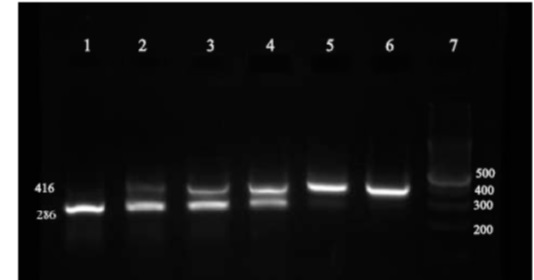
To examine sensitivity and efficiency of Competitive RT-PCR in determining number of copies, target RNA was converted into DNA due to its instability and failure to quantify the copies. Totally, 3*105 copies along with a specific number of competitors (102 – 107) were proliferated through some of the competitive reactions. Following electrophorese of the reaction product on agarose gel, intensity of the color generated by the band that competes with the target DNA band was examined used UVtec. The results of the reaction are pictured in (Fig. 4) and diagram 1 (Fig. 5).
Figure 4 :Results of competitive reaction between the target and control pieces on agarose gel. Number of copies of the target piece in all reactions was the same (3* 105). Number of copies of the control piece from row 1 to row 6 are listed in Table 1 .
| Primer | Primer sequence |
| Pc1 | 5’-TTTGGTTTGGGCTTCACACCATTCC-3º |
| Pc2 | 5’-GTTTCAGAAGCTTCTCCCTG-3’ |
| IntR-Primer | 5-TTTGGTTTGGGCTTCACACCATTCC GCAAGCACCCTATCAGGCAGT -3’ Sequence of Pc1 primer complement sequence with control piece (RPH) |
| IntF-Primer | 5’-GTTTCAGAAGCTTCTCCCTG GAAAGCGTCTAGCCATGGCGT-3’ Sequence of pc2 primer complement sequence with control piece (FPH) |
a) DNA molecule (1pm)= (concentration of DNA based on µg + 1515)/ number of open pairs
b) Each mol of a molecule is Avogadro constant (about 6.02+1023)
Figure 5 : Intensity of color of each band examined in UVtec. The upper diagram indicates the target piece and the lower diagram indicates the control piece
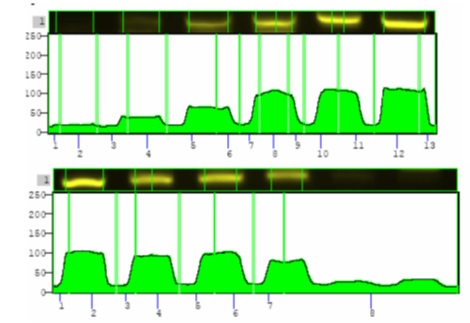
The obtained intensity of color according to UVtec at the row No.4 of the target piece is 1.5 times more than that of internal control band. Taking into account that the target piece is three times more intense than the control, the observed diversity is about 1.2%. Intensity of color for these two pieces and the rest of the rows are listed in Tabl 2. In the case of the unknown samples, intensity of transcripts of the sample is obtained by drawing a linear diagram of color intensity of the control piece and placing color intensity of the target piece on the line for each reaction.
| Row | Number of copies of the target piece | Number of copies of the internal control piece | Observe ratio of color of target piece band to control band | Ratio of target piece to control | Diversity of proliferation (%) |
| 1 | 3*105 | 1*108 | 8/688 | 0.003 | 3.8 |
| 2 | 3*105 | 1*107 | 46/487 | 0.03 | 3.1 |
| 3 | 3*105 | 1*106 | 228/388 | 0.3 | 2.4 |
| 4 | 3*105 | 1*105 | 250/100 | 3 | 1.2 |
| 5 | 3*105 | 1*104 | 250/100 | 30 | 5.2 |
| 6 | 3*105 | 1*103 | 673/2 | 300 | 1.1 |
Discussion
BCR and ABL genes fusion due to DNA translocation led to production of transcripts and proteins consequently, which in turn induced cellular proliferation. Assessment of the number of copies of the transcripts in determining intensity of the disease, response to pharmaceutical treatment, and recurrence of the disease is imperative. Fused transcripts were diagnosed based on RT-PCR following Martinelli.G et al. [9]. Only primers capable of reproducing main breakdown of bcr gene were used. Specificity of the diagnosing method was 100% and its sensitivity was equal to four leukemic cells or about 300 fused transcripts of the sample [10]. A competitive PCR method was also introduced to assess transcripts of the gene. Due to instability of RNA molecule, the competitive process was performed at PCR reaction stage instead of RT stage and the competitor, in general, is a DNA molecule proliferated either through colonization or polymerization reactions of which the number of copies is determined by purification based on the gene. Therefore, inefficiency of RT reaction might influence accurate assessment of number of copies. It is notable that this disadvantage is observed in all quantification system including Real-time PCR. In comparison with Real-time-PCR method, one advantage of the introduced method in this paper is higher numerical value of number of bcr-abl copies determined through competitive method. Therefore, Real-time PCR method is not recommended when the number of transcript in Real-time PCR method is small or negative [7]. Examining the proposed method on internal control and target DNA with a specific number of copies showed a diversity less than 5%, which is negligible in the quantitative assessment. Although quantification was based on intensity of color on the gel and numerical value of this method is not notable, the observed diversity was trivial. Thus, this economic method and recommended for primary examination of number of copies of transcripts of BCR-ABL fused gene.
References
[1]. Inukai T, Sugita K, Suzuki T, Ijima K, Goi K, Tezuka T, et al. A novel 203 kD aberrant BCR-ABL product in a girl with Philadelphia chromosome positive acute lymphoblastic leukaemia. Br J Haematol. 1993;85(4):823-5.
[2]. Sawyers CL, Timson L, Kawasaki ES, Clark SS, Witte ON, Champlin R. Molecular relapse in chronic myelogenous leukemia patients after bone marrow transplantation detected by polymerase chain reaction. Proc Natl Acad Sci U S A. 1990;87(2):563-7.
[3]. Zhang JG, Goldman JM, Cross NC. Characterization of genomic BCR-ABL breakpoints in chronic myeloid leukaemia by PCR. Br J Haematol. 1995;90(1):138-46.
[4]. Gutierrez M TG, Siraj AK, et al. Single monochrome real-time RTPCR assay for identification, quantification and breakpoint cluster region determination of t(9;22) transcripts. journal of Molecular Diagnostics. 2005;7(1):40-7.
[5]. Chasseriau J, Rivet J, Bilan F, Chomel JC, Guilhot F, Bourmeyster N, et al. Characterization of the different BCR-ABL transcripts with a single multiplex RT-PCR. J Mol Diagn. 2004;6(4):343-7.
[6]. Campanini F, Santucci MA, Pattachini L, Brusa G, Piccioli M, Barbieri E, et al. Competitive polymerase chain reaction as a method to detect the amplification of bcr-abl gene of chronic myeloid leukemia. Haematologica. 2001;86(2):167-73.
[7]. Guo JQ, Lin H, Kantarjian H, Talpaz M, Champlin R, Andreeff M, et al. Comparison of competitive-nested PCR and real-time PCR in detecting BCR-ABL fusion transcripts in chronic myeloid leukemia patients. Leukemia. 2002;16(12):2447-53.
[8]. Hoorfar J, Malorny B, Abdulmawjood A, Cook N, Wagner M, Fach P. Practical considerations in design of internal amplification controls for diagnostic PCR assays. J Clin Microbiol. 2004;42(5):1863-8.
[9]. Martinelli G, Testoni N, Montefusco V, Amabile M, Saglio G, Ottaviani E, et al. Detection of bcr-abl transcript in chronic myelogenous leukemia patients by reverse-transcription-polymerase chain reaction and capillary electrophoresis. Haematologica. 1998;83(7):593-601.
[10]. Nazemi A SM, Forouzandeh Moghaddam M, Javadi GH, Hashemi M. Quantitative comparison of NASBA-ELISA and RTPCR- ELISA sensitivities for measurement of the BCR-ABL genes fusion transcript in CML patients. Medical Sciences Journal of Islamic Azad University Tehran Medical Branch. 2008;18(?):67-74.
License
Copyright
© ,
Author Details