Solid Phase Microextraction for Measuring Agricultural Pesticides in Natural Samples
Download
Abstract
Introduction: Fungicides are a group of pesticides which are widely used and have negative effects on human health and the environment; Pesticide residues resulted from applying fungicides is a very important issue due to environmental pollution and human health risk and should be seriously considered. In order to achieve such insight summing up the dangers of pesticides is necessary so that attributes to predict social costs and benefits and monitor new policies applied.
Methods: In this study, the possibility of extracting Triazole, a fungicide was evaluated by utilizing nanostructures, PW/SiO2, using new synthetic microextraction methods. Triazole is one of the most important pesticides with worldwide use for the protection of a variety of vegetables, fruits and grains and the destruction of many fungal pathogens because of its broad-spectrum and systemic properties.
Results: In this study, a new synthetic microextraction is used in which the PW/SiO2 with nano-holes is applied for extraction and identification Triazole; the high specific surface area, selectivity, shape, and size are the main characteristics of these compounds leading to numerous catalytic applications, filtration, separation, and extraction of pesticides.
Conclusion: The optimization conditions for this process include the extraction temperature: 80° C, extraction duration: 45 minutes, desorption temperature: 300° C, desorption duration: 2 minutes. Also, the correlation coefficient was high (0.998) and linear range was broad (0.01 to 200 ng/ml).
Introduction
With the expansion of the world's consumption of chemical fertilizers, chemical fertilizer production industry has become a global industry whichhas also expanded in developing countries as the same extent as in developed countries.The raw material for nitrate fertilizers is ammonium which can be obtained anywhere from nitrogen in the atmosphere and through energy spent. Hence, it is widely produced not only in countries havinginexpensive natural gas, such as the Middle East and the Caribbean but also in countries which are main consumersfor this type of fertilizer such as China and South Asia.
Major producers of phosphate fertilizersare countries which have access to mineral phosphate resources; America, the former Soviet Union, China, Africa, and the Middle East are the main centers for the production of this fertilizer. Some of these countries are developing countries that production of phosphate fertilizers plays an important role in their economy. Potash fertilizer is mainly produced in a few countries so that Russia and Belarus produced 23 percent of the world's potash, alone, Canada produces, Western Europe, Jordan and occupied Palestine together produce 35%, 23% and 11% of the world's potash fertilizer, respectively. The basic tenets of economics and numerous scientific researches indicate that the level of inputs production highly depends on the price of inputs. Thus, for policymaking in the agricultural sector, the price tools has always been one of the most effective political tools. Current policy on chemical fertilizer in Iranis the subsidizing on these inputs [1,2]. The government pro ides farmers with chemical fertilizers at very low prices to help farmers and for the purpose of developing the agricultural sector. Subsidizing on the agricultural inputs is a common policy in most countries, especially developing countries. In fact, the main purpose is to promote and enhance the role of modern inputs such as chemical fertilizers which can substantially increase crop yields. Developing countries are trying to provide food for their growing population in this way and at the same timeimprove the level of income and livelihoods of farmersand even provide an opportunity to export these products and earn foreign exchange through creation thesurplus agricultural production. The current six billion people population of the world will reach 7 billion people by 2020. This risewill include an increase in the population of Chinafrom1.2 billion to 1.5 billion people, South Asia from 1.3 to 1.9 billion people and Africa from 0.7 to 1.2 billion people. Population growth rates in Africa will continue to be the high and high population in China and South Asia will cause the population to concentrate in these three areas in the next two decades. IFPRI estimates that 85% of the growth in demand for food will occur due to population growthin developing countries between 1995 and 2020 [3].
FAO also believes that in addition to the 840 million people who suffered from malnutrition in 1992, 680 million people will be added to this figure by 2010 from which 70% will be in sub-Saharan, Africa, and South Asia, especially in Bangladesh. In Africa and the Near East, the number of hungry will increase and major of these people will be the rural poor which will deprive the sufficient income to provide their minimum food needs, despite a sufficient supply of food [4] Women and children will be the most vulnerable segments of the society due to this process of increase in poverty, thus,all these problems necessitate more than even addressing developed agricultural systems which provide farmers with stable income. According to theresearch by the International Food Policy Research Institute (IFPRI) world grain demand will increase more than 41% between 1993 and 2020with more severity in developing countries,so that the demand for grain will increase 47% and 100% for human food and animal feed purposes, res ectively. This growth in demand will be there in the case of other products. On the other hand, income will grow and faster income growth in developing countries together with the development of urbanization will lead toincrease demand for foods such as red meat that is dependent on forage and grain production. All of these indicates that development in agricultural crops and especiallythe increase in yield per unit area should be followed [5,6].
IFPRI research showswhile the world needs the 40% grain production growth by 2020, the area under grain will grow only 5%by this year;thusimplementing modern farming systems that can increase the yield per unit area, especially in less developed regions is inevitable.In the meantime, it is not easy to estimate the share of chemical fertilizers for the human food supply in the future, however, hundreds of studies in this area some of whichwere mentioned suggest thatchemical fertilizer use is one of the most important available factors to meet these needs [13].
Swaminathan G and Ramanujam T suggest in their article: "The chemical fertilizers are a key to food security for the 0.3 billion Hindi in by 2025 and no country would be able toincrease its agricultural production without use of chemical fertilizers [7] Based on a conservative forecasting for1.3 billion Hindi by 2025 India will need 30 to 35 million tons of three main types of fertilizer (NPK) and 10 million tons of fertilizer from natural and organic sources to produce at least 300 million tons of food per year [8,9]. this problem is made more acute. Scientists have foundincreasing signs of a shortage of phosphorus and potash in agricultural soils, especially the excessive use of nitrogenous fertilizers deteriorate this issue because of disturbing the equilibrium ratio of nitrogen to phosphorus and potassium. In addition, the need to the sulfur for oilseeds and legumes farms is felt.(IFA: 2000) Indiscriminate use of chemical fertilizers will also reduce soil organisms [10,11], and agricultural soils turn to a dead land with very low fertility [12,13]. Fertilizers can cause cancer; The types of cancers include ovarian cancer, breast cancer, brain cancer and gastric cancer [14-20].
All these factors together make excessive use of chemical fertilizers in agriculture a major threat to the environment; therefore the main emphasis of this study is on the measurement of chemical pesticides in agricultural natural resources.
Materials and Methods
Tungstophosphoric acid (PW) nano-clusters was obtained from Merck, silica nanostructure was prepared from Degussa andDiniconazole, Hexaconazole, Triticonazole, Difenoconazole, Tebuconazole, Penconazole were obtained from Giah Company. Working solutions of the above compounds were prepared by diluting the mainsolution with methanol and most of the diluted working solutions were prepared by diluting these solutions with deionized water on a daily basis. Steel wires obtained from the inside of the spinal syringe (diameter 80 μm) and double- deionized water that was used during the experiment. The used pesticides (Diniconazole, Hexaconazole, Triticonazole, Difenoconazole, Tebuconazole, and Penconazole) were sampled up to 0.025 g and measured using a digital scale and poured in a 25 cc volumetric flaskand prepared as a stock solution.
PW/SiO2Nano-composites synthesis
In order to synthesize PW/SiO2, silica powder was stirred for 24 hours in PW solution and was dried for one day at room temperature.
Embeddingthe made fiber on the SPME syringe
The used holding syringe can be seen in the structure (Fig 1). The syringe includes a tube with an internal diameter of 200 μm and a length of 10 cm which is placed inside the needle and is connected to a screw from the other side. When placing the fiber inside the tube the screw is fully closed and microtube comes out of the tip of the needle. In this state, thePW/SiO2fiber is easily placed inside the microtube. So that approximately 1 cm of the non-coated end made of the fiber is slowly pushed into the syringe tube. Steel wire diameter is chosen proportional to the microtube diameter so that it doesn't detach spontaneously from the syringe during the experiment. Protrudingthis screwed end causes the microtube to move inside the needle and its attached fiber is moved out the syringe. In the absorption (intothe headspaceof the sample) and the desorption (inside the injector) stage, fiber is taken out by closing the screw; and during moving the fiber from the sample container the fiber is drawn into the needle by opening and pulling the screwed end.
Figure 1 :the specific syringes used in SPME to hold handmade fibers

It should be noted that the made fiber is conditioned so that the made fiber is entered into the injector with a set temperature for half an hour in order to decontaminate the fiber.
Headspace Solid Phase Microextractionusing the fiber (HS-SPME)
The extraction was conducted as follows:
A. A certain volume of solution with predetermined pH was transferred into an SPME specific 40 ml container and then a certain amount of NaCl with the magnet (for stirring the solution) was added to it; then the container mouth was closed
B. Then, the extraction container was heated in the beaker containing water and to a specified time at a given temperature.
C. HS-SPME needle containingmade fiberwas entered slowly and carefully into the container through its rubber cap and was placed headspace the solution. In all extractions, it always was tried to place the needle at a constant height from the surface of the solution.
D. Then, the plunger was lowered slowly so that the fiber was exited the tip of the holder needle in order to extract. Then, the fiber was placed headspace the solution for a specified time (extraction time).
E. At the end of the extraction time, the fiber was drawn into the syringe slowly and carefully.
F. Finally, the needle was removed slowly from the extraction container.
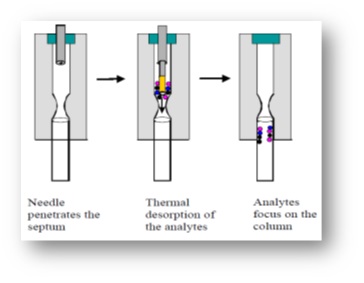
G. The syringe was placed in GC-MS injector and the fiber was removed from the tip of holding needle so that desorption of the species from the fiber was done for 2 minutes (desorption time). Then, the separation was performed on a GC column; extractionand injection into the gas chromatography steps are shown in (Fig. 2-3).
Figure 2 :steps of the extraction from the headspace by made fiber
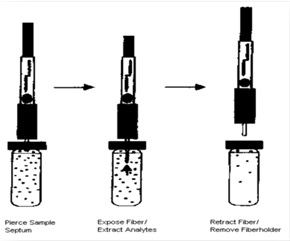
Figure 3 :steps of the extraction from the headspace by made fiber
Milk samples
Milk samples were collected from the Pegah and Sutchilar milk factories, Tabriz in October2015 and they were kept at 4° C until analysis. Before the analysis,the milk sample was clotted by acetic acid and the solution was removed from the obtained colloid and was used for analysis in solid phase microextraction method.
The real sample analysis
Several parameters are considered in selecting the metal to preparethe fiber. Mechanical strength, heat resistance, low cost, the suitable tendency to epoxy resin, and the metal inertia are some parameters that are considered for selection the metal for the fiber. Wires made of copper, platinum and stainless steel are among the wires that are used for this purpose. Stainless steel wire has stronger mechanical properties as compared to the previously used platinum wire. Preference of the stainless steel wire to similar platinum wire is due to the high price of platinum one. In addition, the steel wire does not absorb volatile compounds.
In order to choose the type of adhesive some parameters such as desired adhesion strength, lack of thermal decomposition at high temperatures and lack of absorption of volatile compounds analyzed to avoid the background effects is considered. Considering these parameters, the epoxy adhesive has been used in previous works. In this work, two epoxy adhesives, dark and colorless were examined and it was observed that dark-type is got black during the thermal drying and also during the injection in a high temperature of the GC injector, and fiber loses its property as a result, However,the Colorless-type has not thisfeature. Hence the colorless epoxy adhesive (manufactured by Ghaffari Co.) was used to stabilize the absorbent phase. Chromatogram obtained with wire dipped in adhesive did not show any significant spectrum indicating that the adhesive has not significant backgroundabsorption.
In previous works,the made fiber was placed in the oven at 80° C for 12 hours to epoxy adhesive solvent evaporates. However, in our study under the conditions mentioned the used adhesive get black and the fiber had not appropriate absorption properties. For this reason, other temperatures and timedurations were used for this purpose, and finally,50° C for 24 hours was selected.
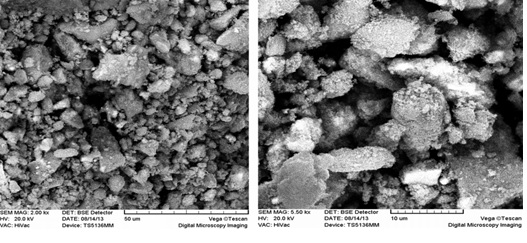
The electron microscopy is one of the most widely used devices in studies on the properties of nanostructured materials.The scanning electron microscopy is used in most examinationson the properties of nanostructured materials to determine their size and form is used. (Fig. 4-5) show scanning electron microscopy images in case offiber and PW/SiO2 and SiO2nanocomposite structure. Fiber surface morphologyindicatesthe uniformityof nanocomposite coating on the fiber and synthesized material. In this project, the electron microscope LEO 1430VP from the University of Ardabil was used to examine the material structure.
Figure 4 :SEM image of the SPME fiber coated by nanocomposite PW/SiO2
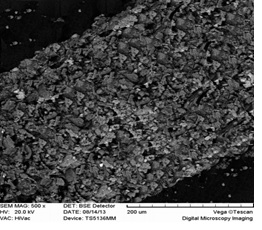
Figure 5 :SEM images of nanomaterials, PW/SiO2, and SiO2
In order to obtain proper separation between the peaks of the species in the column and achieve symmetric and sharp peaks, the optimum separation conditions and different temperature regimes and different ratios of the split were studied. Finally, for Triazole compounds, detector temperature of 260° C, the entrance of injection temperature of 260° C, injection without split and the rate of helium gas flow into the column of 9.0 ml/min was determined; and for BTEX, detector temperature of 260° C, the entrance of injection temperature of 300° C, injection without split and the rate of helium gas flow into the column of 9.0 ml/min were determined. The optimal temperature program for Triazole compounds consisting of three stages was selectedas (Tabl 1):
| Time Constant Temperature(min) | (˚C)Temperature | Temperature Chang Value(˚C/min) |
| 2 | 100 | - |
| 0 | 200 | 20 |
| 0 | 280 | 10 |
| 5 | 280 | - |
Figure 6 :The chromatogram of six compounds (1) Penconazole, (2) Hexaconazole, (3) Diniconazole, (4) Tebuconazole, (5) Triticonazole, (6) Difenoconazole
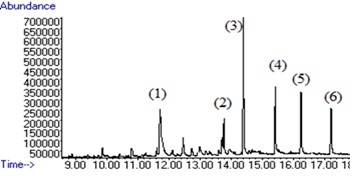
The milk samples were obtained from Pegah and Sutchilar milk factories, Tabriz in October 2015 and were keptat 4° C until analysis. Before the analysis, the milk samples were clotted by acetic acid and the solution was removed from the obtained colloid and was used for analysis in solid phase microextraction method.
Temperature has a dual effect in solid phase microextraction
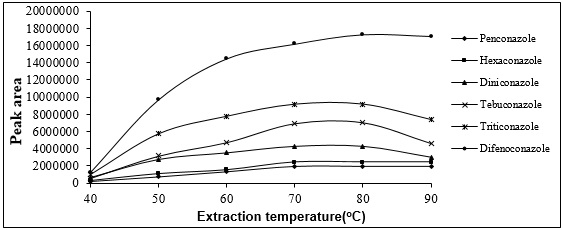
That is, as the temperature increase canincrease the amount of extracted analyte by increasing the analyte distribution coefficients between the headspace and the fiber, at the same time,it can reduce the analyte distribution coefficients between the headspace and the fiber. Therefore, it is absolutely essential to optimize the extraction temperature. For this, the extraction of Triazolesfromthe headspace of the sample solution was done at various temperatures ranging from 40 to 90° C. The following figure shows the area of the peak of the analyte in response to applied temperature. According to this figure, the highest extraction efficiency occurs at 80° C (Fig. 7).
Figure 7 :plot of analyte peak area changes with extraction temperature changes
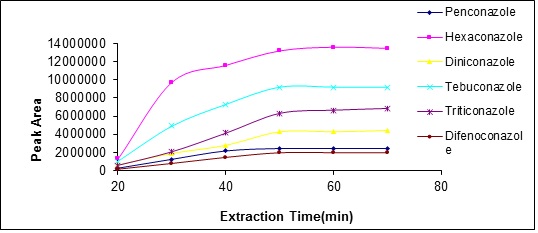
In solid phase microextraction, extraction duration is an important factor so that affects analyte distribution between the solution and the fiber.The highest sensitivity and reproducibility is obtained when the balance of analyte distribution between the fiber and the sample is established. In this study, the extraction process was studied in a period of 20 to 60 minutes for examining the effect of time duration on the amount of analyte extracted. The results show that after 45 minutes, the amount of analyte extracted will be reduced, thus, the 45 minutes was selected as the optimum duration (Fig. 8).
Figure 8 :plot of analyte peak area changes with extraction temperature changes
Stirring the solution increases the mass transfer rate in the transferor phase and reduces the time required to achieve balance and the extraction time. Variousstirringrates (0 to 700 rpm) were studied to determine its effects on the preconcentration of Triazole compounds. According to results, the extraction of Triazole was increased by increasing stirringrateup to 500 rpm. As a result, the rate of 500 rpm was chosen as the optimal speed. At higher stirring rates, the measurement accuracy will be reduced due to air bubbles and volatility.
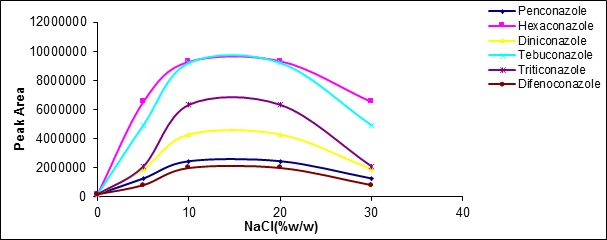
Adding the salt increasesthe ionic strength of the transferor phase anddecreasesthe tendency to the organic phase improving the performance of analyte extraction in many common methods of extraction.In this work, NaCl salt was added to the samples from 0 to 30 volumetric wt%. Salinization up to 15 volumetric wt% increases extraction efficiency, but in higher concentrations, the extraction efficiency was declined. This reduction in extraction efficiency attributed to electrostatic effects (Fig. 9).
Figure 9 :the effect of ionic strength changes on the extractionrate
The analyte desorption in SPME coupled with gas chromatography is in the thermal form. Therefore, choosing the appropriate valuesfordesorption duration and temperature to achieve proper results in this method is essential. By optimizing these two factors, sensitivity and reproducibility of the method are always at maximum values. Injection valve temperature was set 120 to 300° C. The results showed that the highest desorption ratetakes place at the temperature of 300° C. In addition, the optimal desorption durationfor all measurements was considered as 2 minutes.
The effect of pH was examined on the extraction rate individually and from acidic to alkaline values (2-10).(Fig 10) shows the effect of pH changes on the extraction rate. As this figure implies, the pH equal to 6 is optimum extraction point.
Figure 10 :The effects of pH changes on the extraction rate
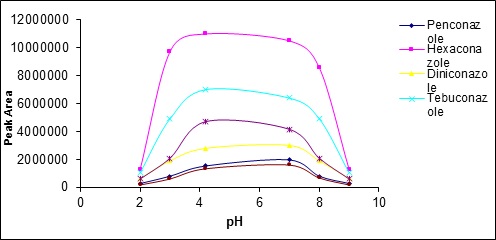
The results indicate that either in pH too acidic and in the alkaline pH the extraction rate reduced. At high pH (alkaline), Triazole compounds convert to ionic compounds because of their relatively low acidity. Therefore,solution phase/vapor phase balance moves to the solution side and the amount of these compounds reduces in the headspacewhich leads to reduced extraction rate. At acidic pH, it seems that the amount of Triazole compounds in the headspace decreases and consequently the extraction rate reduces due to increasing the possibility of hydrogen bond formation between the water solvent and Triazole compounds.
Reproducibility of the method was investigated in optimal conditions for 5 replications. The compound concentration was calculated applying the values of the area under the peak and calibration curves. The results for four compounds are shown in (Tabl 2).
The observed the relatively high value of RSD (relative standard deviation) may be due to the following reasons:
A) The extraction phases in SPME method are very small and thuseven the smallest change leads to significant error.
B) The fiber position and arrangement against the water sample and the tip of the needle influence the amount of RSD. In this study, we tried to setthe fiber in a stable state in consecutive experiments.
c) Another factor is the made fiber uniformity which can affect the RSDvalue.
d) The high RSD in chromatographic methods.
| Difenoconazole | Triticonazole | Tebuconazole | Diniconazole | Hexaconazole | Penconazole | Frequency |
| 6.12 | 5.23 | 6.32 | 4.33 | 5.12 | 5.0 | RSD% |
Extraction by 5 fibers which are made in same was done in the optimum extraction conditions. Results based on the obtained concentrations are shown in (Tabl 3).
| Difenoconazole | Triticonazole | Tebuconazole | Diniconazole | Hexaconazole | Penconazole | Frequency |
| 6.23 | 5.54 | 5.42 | 6.73 | 5.23 | 4.33 | RSD% |
In order to estimate the efficiency of made fiber for extractingconsidered Triazole compounds in defined optimal conditions, a handmade nanoporous fiber and a commercial fiber, PDMS was used for extraction and the area under the peaks was calculated.The results showed that the extraction efficiency by the made fiber is considerably higher than commercial fiber, PDMS in the given conditions for Triazole compounds extraction.
In order to estimate the concentration of an unknown sample, it is required that the graph ofanalyte extracted from standard samples be drawn by the concentration. To draw these graphs, certain concentrations of the sample were analyzed in optimal conditions.
The areas under peakswere calculated and the related graphs were drawn. Using the linear part of these graphs the concentration of these compounds in the unknown sample could be calculated givenits area under the peak. In (Tabl )the linear range of graphs and the slope of the linear range are obtained.
The limit of detection is a concentration of test samples which its response is equal to the sum of control sample responses and three times of the standard deviation depended on control sample response. The mathematical expression of the detection limit is as follows:
Y = YB + 3SB
SB: Standard deviation
YB: control sample response
We also used this definition to calculate the detection limit. According to standardization diagrams for considered Triazole compounds, the results of (Tabl 4) were obtained for the slope of curves and LOD for each of the compounds.
| Sampl | R2 | Linear Range (mg mL-1) | LOD (ng mL-1) |
| Penconazole | 0.996 | 0.01-200 | 0.011 |
| Hexaconazole | 0.996 | 0.01-200 | 0.018 |
| Diniconazole | 0.998 | 0.01-200 | 0.015 |
| Tebuconazole | 0.997 | 0.01-200 | 0.012 |
| Triticonazole | 0.967 | 0.01-200 | 0.014 |
| Difenoconazole | 0.996 | 0.01-200 | 0.017 |
In order to estimate the efficiency of the made fiber for extracting the Triazole compounds, two water samples were analyzed as real samples under determined optimal conditions. Nowkandeh and Karganrood rivers water constitute water samples analyzed. The samples were analyzed in obtained optimal condition but since no peak was observed,spike method was used to analyzeTriazole compounds in these samples. For this purpose, a certain amount of concentrated solution containing intended Triazole compounds was added to the samples, so that the concentration of these compounds reach to reach 10 μg/l. Then these solutionswere analyzed under optimal conditions. The results show that there is a good agreement between values added andmeasured by thismethod. Results are listed in (Tabl 5). We can conclude that these natural samples at this level of concentration are free of considered Triazole compounds.
| Sample | Added value (mg mL-1) | Calculated value (mg mL-1) | |||||
| Difenoconazole | Triticonazole | Tebuconazole | Diniconazole | Hexaconazole | Penconazole | ||
| Tabriz Pegah Milk | 10 | 10.3 (0.6) | 10.2(0.4) | 10.2(0.8) | 10.7(0.6) | 10.1(0.5) | 10.2(0.4) |
| Sounchiar Milk | 10 | 10.1(0.5) | 10.3(0.2) | 10.1(0.5) | 11.1(0.9) | 10.9(0.7) | 10.2(0.4) |
In Conclusion,in these studies, a fully sensitive technique based on solid phasemicroextraction using PW/SiO2 nanostructure has been developedfor the first time to determine Triazole compounds in aqueous samples. This method has a suitable linear range andhigh repeatability and high sensitivity. The proposed method can be used for other studies on aromatic compounds with low concentrations in water and soil and so on. The results show that the prepared composites fiber has high extracting power. High sensitivity, not usingthe organic solvent, high selectivity, and low detection limits are among the unique advantagesof the proposed method. PW/SiO2 nanostructured fiber SPME has high efficiency inextractingthe moderately polar compounds compared to commercial fiber, PDMS. For preparingthe PW/SiO2 nanostructured fiber metal wires were used instead of fused silica,thus,a fiber break problem which is one of the SPME fiber problemshas been resolved. PW/SiO2 nanostructured has high potential to use as thefiber SPME coatingbecause of its high porosity and high thermal resistance. Triazole compounds extraction from aqueous solution using PW/SiO2 nanostructuredfiber has a good reproducibility. PW/SiO2 nanostructuredfiber has advantages including high thermal stability, ease of preparation, low cost, high strength, and durability.
References
[1]. Cordell D, Drangert J-O, White S. The story of phosphorus: global food security and food for thought. Global environmental change.2009;19(2):292-305.
[2]. Godfray HC, Beddington JR, Crute IR, Haddad L, Lawrence D, Muir JF, et al. Food security: the challenge of feeding 9 billion people. Science. 2010;327(5967):812-8
[3]. Siegel PB, Alwang J. An asset-based approach to social risk management: A conceptual framework: The World Bank.1999.
[4]. Paez-Osuna F. The environmental impact of shrimp aquaculture: a global perspective. Environ Pollut. 2001;112(2):229-31.
[5]. Allan JA. 'Virtual water': a long-term solution for water short Middle Eastern economies? School of Oriental and African Studies, University of London.1997
[6]. Meinzen-Dick RS, Brown LR, Feldstein HS, Quisumbing AR. Gender, property rights, and natural resources. World development.1997;25(8):1303-15.
[7]. Swaminathan G, Ramanujam T. Effect of substrate concentration on biodegradation of 2, 4-dichlorophenol using modified rotating biological contactors. Bioprocess Engineering.1999;21(2):169-73.
[8]. Hamadi NK, Swaminathan S, Chen XD. Adsorption of paraquat dichloride from aqueous solution by activated carbon derived from used tires. Journal of Hazardous Materials.2004;112(1):133-41.
[9]. Sivagami K, Krishna RR, Swaminathan T. Photocatalytic degradation of pesticides in immobilized bead photoreactor under solar irradiation. Solar Energy.2014; 103:488-93.
[10]. Cole DC, Sherwood S, Crissman C, Barrera V, Espinosa P. Pesticides and health in highland Ecuadorian potato production: assessing impacts and developing responses. Int J Occup Environ Health. 2002;8(3):182-90.
[11]. Fishel FM. Pesticide toxicity profile: synthetic pyrethroid pesticides. This document is PI-54, one of a Series of the Agronomy Department, Florida Cooperative Extension Service, Institute of Food and Agricultural Sciences, the University of Florida, Published July.2005.
[12]. Ware GW. Pesticides. Theory and application: WH Freeman & Co.1983.
[13]. Gard NW, Hooper MJ, Bennett R. An assessment of potential hazards of pesticides and environmental contaminants. Ecology and management of Neotropical migratory birds: a synthesis and review of critical issues Oxford University Press, New York, NY.1995;294-310.
[14]. Mohammadi H, Abedi A, et al. Evaluation of synthesized platinum nanoparticles on the MCF-7 and HepG-2 cancer cell lines, International Nano Letters, 2013, vol. 3, no.1, p 1-5.
[15]. Khalili M, Akbarzadeh A, et al. The effect of nanoliposomal and PE gylated nanoliposomal forms of 6-gingerol on breast cancer cells, Research Journal of Recent Sciences, 2009, vol. 2277, p. 2502.
[16]. Esfahani MKM et al. Pegylation of nanoliposomal paclitaxel enhances its efficacy in breast cancer, Tropical Journal of Pharmaceutical Research, 2014, vol. 13, no. 8, p. 1195-1198.
[17]. Izadi M, EbrahimiShahemabadi H, Kanaani L, et al . Investigation of characteristics of loaded carboplatin on the liposomal nanoparticles on the cell carcinoma of the human brain c6. Adv. Biores.2016;7(4):113-118.
[18]. Amiri B, Ebrahimi-Far M, Saffari Z, Akbarzadeh A, Soleimani E, Chiani M. Preparation, Characterization and Cytotoxicity of Silibinin- Containing Nanoniosomes in T47D Human Breast Carcinoma Cells. Asian Pacific journal of cancer prevention : APJCP. 2016;17(8):3835-8.
License
Copyright
© ,
Author Details