Prognostic Value of Absolute Lymphocyte count, Lymphocyte percentage, Serum albumin, Aberrant Expression of CD7, CD19 and the Tumor Suppressors (PTEN and p53) in Patients with Acute Myeloid Leukemia
Download
Abstract
Background: Acute myeloid leukemia (AML) is a hematopoietic neoplasm. Tumor suppressors have a magnificent role in preventing the AML process. The absolute lymphocyte count is a simple yet statistically powerful estimate in patients with acute leukemia besides the lymphocyte’s percentage.
Aim: Investigating the prognostic value of absolute lymphocyte count, lymphocyte percentage, serum albumin, the aberrant expression of CD7and CD19 and the tumor suppressor genes (PTEN and p53) in patients with AML.
Methods: 35 de novo AML patients were included. They received the standard induction chemotherapy (3+7 protocol) and were followed up for one year after treatment. 15 normal healthy individuals, age and sex matched constituted the controls.
Results: The mean overall survival of patients with lymphocyte percentage ≤25 was low compared to those with high lymphocyte percentage (>25%) (χ2 =5.808, P=0.016). AML patients with low levels of ALC showed significantly shorter overall survival than patients with high levels (χ2 =4.587, P= 0.032). AML patients with low serum albumin were of low overall survival compared to those with normal level (χ2 =8.698, P=0.003). Patients with aberrant CD7 expression showed short survival and unresponsiveness to treatment than CD7 negative patients. PTEN gene expression and p53 protein level were significantly lower in AML patients compared to the control group.
Conclusion: The decrease in ALC, lymphocyte percentage, albumin concentration and the increase in monocyte percentage indicates bad prognosis in AML patients. The Aberrant CD7 expression, very low expression of PTEN and low level of p53 could estimate the unresponsiveness to standard chemotherapy.
Introduction
Acute myeloid leukemia is an aggressive clonal hematopoietic neoplasm [1] characterized by proliferation of immature myeloid cells, decreased apoptosis and genomic instability. These genetic alterations may include inappropriate expression of oncogenes or loss of function of tumor suppressor genes [2].
In Egypt, a series of 83,500 newly diagnosed cancer cases was studied by the National Cancer Institute (NCI), during the period between 2002 and 2010. In 75,036 cases of adults, acute leukemic cases constituted 7.7% of newly diagnosed cancer cases in both sexes. Sex distribution of AML cases shows slight male predominance with male: female ratio 1.15:1. The mean age of adult leukemia is 42.5 years [3].
Despite the progress of AML classification, there are simple prognostic markers with different clinical outcomes.
PTEN (Phosphatase and tensin homolog on chromosome 10) is a tumor suppressor gene regulating apoptosis and cell survival by inhibiting the PI3K/AKT signaling pathway [4] originating from epidermal growth factor receptor (EGFR) activation or activation of other tyrosine kinase receptors [5], which are involved in angiogenesis, growth, proliferation and survival [4]. The dysregulation of PTEN may give rise to many aspects of cancer development such as cell proliferation and apoptosis resistance [6]. PTEN gene mutation or deletion has been related to many types of cancers [7] and hematological malignancies [8].
PI3K/AKT pathway is also regulated by p53, a tumor suppressor protein encoded by the Tp53 gene that has an incredible job in DNA damaged incited cell death [9]. A reciprocal regulation may exist between the PI3K-Akt pathway and the tumor suppressor protein p53 [10] as PTEN is a transcriptional target of p53 [11]. Mutation or deletion of Tp53 gene disrupts p53 pathway leading to AML [12].
Accurate assessment of prognosis is central to the management of AML. By stratifying patients according to their risk of treatment resistance or treatment-related mortality (TRM), prognostic factors help guide the physician in deciding between standard or increased treatment intensity, consolidation chemotherapy or allogenic hematopoietic stem cell transplant, or more fundamentally in choosing between established or investigational therapies [13]. Therefore, we aimed at investigating the prognostic value of lymphocyte count, lymphocyte percentage serum albumin, the aberrant expression of CD7 besides the tumor suppressor genes (PTEN and p53) in patients with AML.
Materials and Methods
The research incorporated fifty subjects divided into:
Group1: 15 healthy controls (age and sex matched)
Group2: 35 patients with de novo AML. Patients with secondary AML, therapy related AML, patients with promyelocytic anemia (M3), patients with comorbid disease (hepatic, renal and cardiac) and patients >60 years old or <18 years old were excluded.
These patients were recruited from patients admitted to the Hematology Department of the Medical Research Institute, Alexandria University, Egypt during the period from June/2016 to December/2016.
A written consent was taken from patients and control after explaining the nature, steps and the research’s aim. The approval of the MRI ethical committee was obtained. For remission induction, all patients received the 3+7 standard protocol (daunorubicin 60-90 mg/m2/day for 3 days + cytarabine 100-200 mg/m2 for 7 days), then all patients were reevaluated (peripheral blood (PB) and bone marrow (BM) aspirate samples were repeated) for complete remission achievement (BM blasts <5%) on day 28 [14]. After that, the patients were monitored for one year. Patients were thoroughly examined and were subjected to full history taking including (Age, Gender, Symptoms, Medical history, Family history of leukemia or other malignancies), Complete blood picture (CBC) [15], Bone marrow aspiration for Flow cytometric immunophenotyping [16], Colorimetric estimation of serum albumin [17], ELISA test for serum p53 [18] and real time PCR to determine PTEN gene expression [19].
Complete Blood Count (CBC)
CBC was done on an automated cell counter (Sysmex XT-1800I, Japan) to the patients before and after treatment.
Bone Marrow Aspiration and Immunophenotyping (For Patients Only)
Direct immune fluorescence staining was done on the bone marrow aspirates using specific directly conjugated flourochrome-labeled monoclonal mouse anti-human antibodies as per the manufacturer instructions. Immunofluorescence was analyzed using Becton Dickinson FACS Caliber flow cytometer equipped with BD Cell Quest pro software (BD biosciences, San Jose, CA, USA) to diagnose acute leukemia. This panel includes:
- A primary panel was used to distinguish AML from ALL: CD13, CD33, CD117, anti-MPO, CD19, CD79a, CD7, and cCD3.
- CD34 and CD45 were also done where, CD34 is a non-lineage specific marker expressed in hematopoietic progenitor cells and CD45 is a pan myeloid marker.
- CD64 and CD11c were done if monocytic AML was expected.
The percentage of CDs expression from gated blast cells was recorded and the expression was considered positive when ≥ 20% of the gated cells expressed it at the diagnosis time.
Colorimetric Estimation of serum albumin
It was done to determine the concentration of serum albumin of the control group and the patients before and after treatment.
The method is based on the specific binding of bromocresol green (BCG), an anionic dye and the protein at acidic PH with the resulting shift in absorption wave length of the complex. The intensity of the colour formed is proportional to the concentration of albumin in the sample.
PH 4.3
BCG + Albumin → BCG-albumin complex
ELISA Test
The ELISA test was done on the serum of the 2 groups to determine the serum concentration of p53 protein.
The microtiter plate wells was provided coated by purified human P53 antibody to make solid-phase antibody, samples containing P53 antigen was added to wells, also combined P53 antibody which with horse redox peroxidase (HRP) labeled became antibody-antigen- enzyme antibody complex, after washing completely, the 3,3’,5,5’ tetra methyl benzidine (TMB) substrate solution was added where the TMB substrate became blue color at HRP enzyme- catalyzed. The reaction was terminated by the addition of sulphuric acid and the color change was measured spectrophotometrically at a wave length of 450 nm. The concentration of P53 in the samples was determined by comparing the optical density (O.D) of the samples to the standard curve.
Real Time PCR
It was done for the patients before treatment and the control group to determine the expression of the PTEN gene using comparative CT method, where ACTB was used as a house keeping gene. The relative amount of PTEN normalized to ACTB was calculated with the equation 2 -ΔΔCT Where:
ΔΔCT= (C T target gene – C T ACTB) patient – (C T target gene – C T ACTB ) control
Fold change = 2-ΔΔCT
Thus, the expression produced by the control group will be equal to one, any positive value will represent an upregulation while a negative value will represent a downregulation in gene expression, as compared to the control group.
Statistical analysis
Statistical analysis was formed using IBM SPSS statistics “version 21” [20]. Quantitative data were described by mean as measure of central tendency& standard- error and minimum, maximum as measure of dispersion. Mixed design ANOVA done to detect statistical significant difference in the mean of quantitative variables before and after therapy.
Independent sample t test and Mann Whitney test were used to study statistical significance in the mean of quantitative variables between patients groups and healthy controls. Wilcoxon signed rank test was done to prove statistical significance in the mean of quantitative variables before and after treatment in patients group. All the statistical tests were two tailed and done at 0.05 level of significance.
Results
The studied patients (35) included 17males (48.6%) and 18 females (51.4%); their ages ranged from 19 to 60 years with a mean± SE (44.85±2.17).
1. Flow Cytometric Immunophenotyping (FCI) Analysis in AML Patients.
Almost all the cases were positive for CD13, CD33, CD34, CD45 and anti MPO but only 9 cases (25.7 %) were CD117 positive, 4 cases (11.4 %) were CD64 and CD11c positive which represents AML with monocytic component. Aberrant expression of B-cell markers was found in only 2 cases (5.7%) showing expression of CD19 and aberrant expression of the T-cell marker (CD7) was seen in 9 cases (25.7%). On the other hand, all the cases were negative for CD79a and cCD3 indicating the absence of ALL.
2. Hematological Analysis:
Table (1): Hematological results of all the studied group
| Parameter | Control group | AML patients (n=35) | ||
| (n=15) | Before treatment | After treatment | ||
| Hb (g/dl) | Mean± SE | 13.88±0.195 | 8.46±0.294 | 9.36±0.292 |
| P1 | 0.000* | 0.001* | ||
| P2 | 0.897 | |||
| RBCs (x106/µl) | Mean± SE | 4.84±0.103 | 2.88±0.127 | 2.78±0.287 |
| P1 | 0.000* | 0.000* | ||
| P2 | 0.756 | |||
| WBCs (x103/µl) | Mean± SE | 7.41±0.351 | 34.67±11.73 | 5.19±0.297 |
| P1 | 0.003* | 0.000* | ||
| P2 | 0.000* | |||
| Lymphocytes (%) | Mean± SE | 38.73±1.66 | 23.53±2.12 | 21.14±2.41 |
| P1 | 0.000* | 0.000* | ||
| P2 | 0.459 | |||
| Monocytes (%) | Mean± SE | 6.33±0.64 | 12.21±1.48 | 6.57±0.91 |
| P1 | 0.014* | 0.871 | ||
| P2 | 0.002* | |||
| Platelets (x103/µl) | Mean± SE | 262.73±11.90 | 59.31±8.07 | 103.44±15.92 |
| P1 | 0.000* | 0.000* | ||
| P2 | 0.032* | |||
| ALC (x109/l) | Mean±SE | 2.86±0.18 | 10.40±3.55 | 1.05±0.122 |
| P1 | 0.002* | 0.001* | ||
| P2 | 0.001* | |||
| AMC (x109/l) | Mean± SE | 0.47±0. 053 | 4.28±2.09 | 0.33±0.057 |
| P1 | 0.005* | 0.164 | ||
| P2 | 0.003* | |||
| ALC/AMC ratio | Mean± SE | 7.85±1.37 | 3.74±0.79 | 4.49±0.67 |
| P1 | 0.009* | 0.018* | ||
| P2 | 0.495 | |||
| Bone marrow blasts (%) | Mean± SE | - | 57.68±4.84 | 4.22±0. 67 |
| P2 | 0.000* | |||
| Peripheral blood blasts (%) | Mean± SE | 0.0±0.0 | 34.94±6.19 | 0.40±0.24 |
| P1 | 0.000* | 0.216 | ||
| P2 | 0.000* |
*Hb, hemoglobin; RBCs, red blood cells; WBCs, white blood cells; ALC, absolute lymphocyte count; AMC, absolute monocyte count; ALC/AMC, absolute monocyte count/absolute monocyte count ratio; AML, acute myeloid leukemia; SE, standard error; P1, P value for Mann Whitney test comparing between control groups with each studied group; P2, P value for Mann Whitney test comparing between AML patients before and after treatment, *, Statistically significant at p ≤ 0.05.
3. Tumor Suppressor Genes
3.1. PTEN Gene Expression
The expression of PTEN in the control group equals 1 and any positive value indicates over expression but the negative value indicates down expression. The patients before treatment showed down expression of PTEN gene compared to the control group (P=0.000) and among the patients, 60% of them showed low expression (>0.5) and 40% of them showed very low expression (≤0.5).
3.2. p53
The p53 concentration was significantly higher in the patients after treatment when compared to before treatment (P1=0.000).
4. Clinical Outcome:
After the patients were treated with 3+7 induction protocol, bone marrow examination was done on day 28 to determine the patients’ response to therapy and the patients were monitored for 1 year (Table 2).
| Outcome | No | % | |
| Complete remission from first time | 21 | 60 | |
| Complete remission from second time | survived | 4 | 11.43 |
| died | 2 | 5.71 | |
| Died | 8 | 22.86 | |
| Total | 35 | 100 |
*No, number of patients
Table (2): Patients’ response after chemotherapy.
5. Overall Survival Analysis
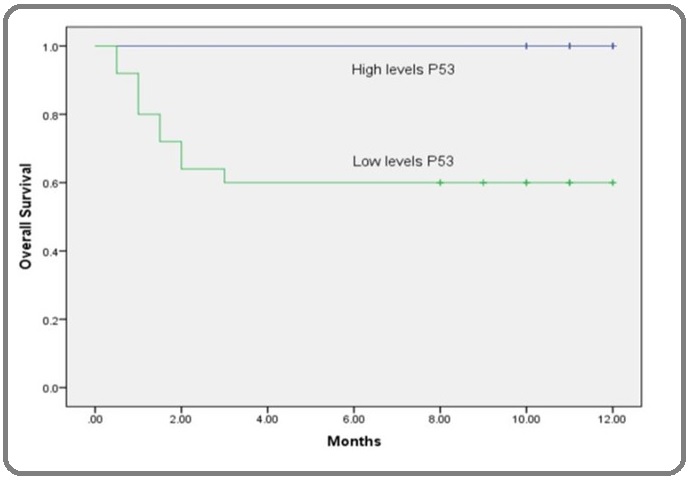
To study the prognostic values of all the parameters, Kaplan-Meier survival curve was constructed (Table 3, Figures 1-7).
Table (3): The overall survival of all the studied parameters
| Parameter | Mean overall survival (months) | Log rank |
| χ2 | P | |
| CD7 positivity | 21.22 | 0.000* |
| Positive CD7 | 3.5 | |
| CD7 Negative | 10.86 | |
| Albumin (g/dl) | 8.698 | 0.003* |
| Low albumin (≤3.5g/dl) | 6.61 | |
| High albumin (>3.5g/dl) | 11.47 | |
| Lymphocyte (%) | 5.808 | 0.016* |
| Low lymphocyte% (≤25 %) | 6.7 | |
| High lymphocyte % (>25%) | 10.45 | |
| ALC (x109/l) | 4.587 | 0.032* |
| ALC (≤5 x10⁹/l) | 6.81 | |
| ALC (>5 x10⁹/l) | 10.37 | |
| ALC/AMC | 0.722 | 0.395 |
| ALC/AMC (≤10) | 8.77 | |
| ALC/AMC (>10) | 10 | |
| Blast cells in BM (%) | 6.679 | 0.010* |
| Low blast cells (≤50%) | 10.25 | |
| High blast cells (>50%) | 6.22 | |
| WBCs (x103/µl) | 7.253 | 0.007* |
| Low WBCs counts (≤10 x103/µl) | 11.2 | |
| High WBCs counts (>10 x103/µl) | 6.4 | |
| PTEN gene expression | 5.808 | 0.016* |
| Low PTEN gene expression (>0.5) | 10 | |
| Very low PTEN gene expression (≤0.5) | 6.88 | |
| P53 (nmole/ml) | 5.022 | 0.025* |
| Low serum P53 levels (≤5 nmole/ml) | 6.44 | |
| High serum P53 levels (>5nmole/ml) | 11.03 |
*CD7, cluster of differentiation 7; WBCs, white blood cells; ALC, absolute lymphocyte count; ALC/AMC, absolute monocyte count/absolute monocyte count ratio; BM, bone marrow; PTEN, Phosphatase and tensin homolog on chromosome 10; *, Statistically significant at p ≤ 0.05
Figure 1: Kaplan-Meier Overall-survival Curve According to CD7 Positivity in AML Patients. The Kaplan-Meier overall-survival showed that there was statistical significant difference (P=0.000) in survival between CD7 positive patients and CD7 negative patients where the CD7 positive had 21.22 times more probability of death.
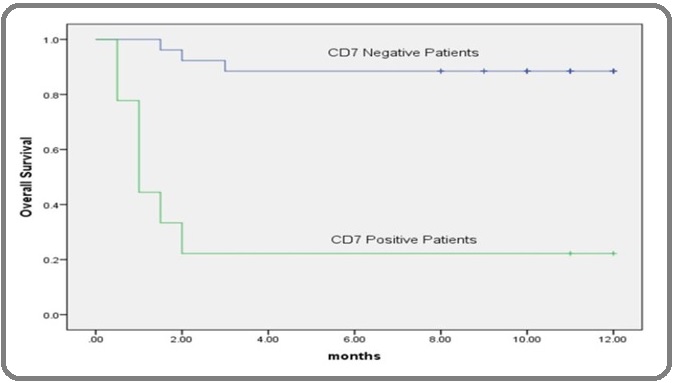
Figure 2: Kaplan-Meier Overall-survival Curve According to Serum Albumin Level in AML Patients. Kaplan–Meier test was used to estimate the overall survival of AML patients according to the concentration of albumin in serum (g/dl) which revealed that AML patients with low serum level of albumin than its corresponding cut-off point (≤3.5) was of lower survival than those with high levels.
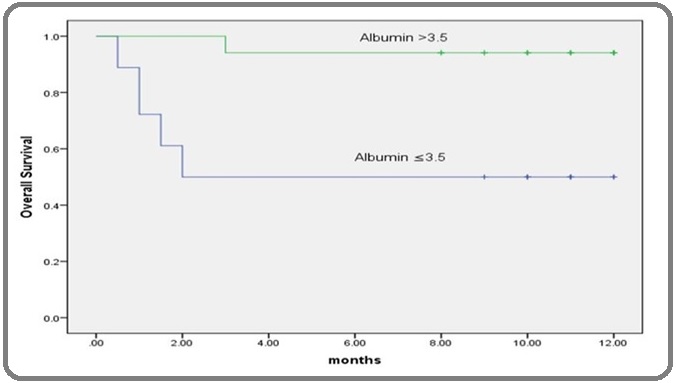
Figure 3: Kaplan-Meier Overall-survival Curve According to Lymphocyte % in AML Patients. The Kaplan-Meier overall-survival showed that there was statistical significant difference (P=0.016) in the overall survival among patients with low lymphocyte percentage than the cutoff point and they had 5.808 times more probability of death than those with high lymphocyte percentage.
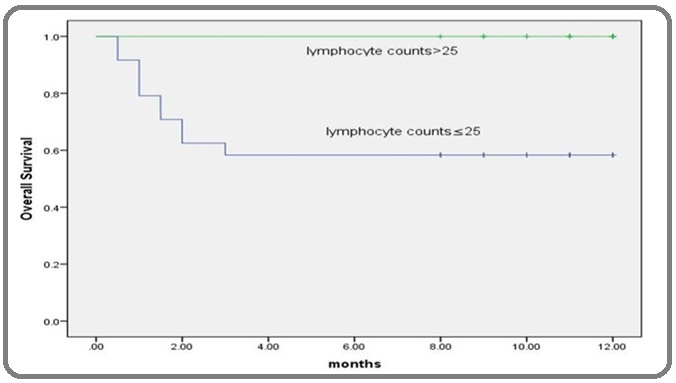
Figure 4: Kaplan-Meier Overall-survival Curve According to ALC in AML Patients. Kaplan-Meier survival curve for AML patients revealed that, patients with lower levels of ALC (x109/l) than its corresponding cut-off point had shorter overall survival time than patients with higher levels the difference was statistically significant according to the log rank test (p<0.05).
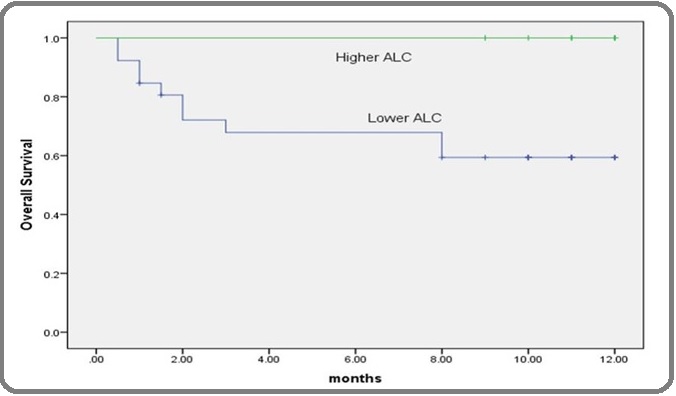
Figure 5: Kaplan-Meier Overall-survival Curve According to ALC/ AMC Ratio in AML Patients. The Kaplan-Meier overall-survival showed that there was no statistical significant difference (P=0.395) in the overall survival among patients with low ALC/AMC ratio than the cutoff point and patients with high ALC/ AMC ratio.
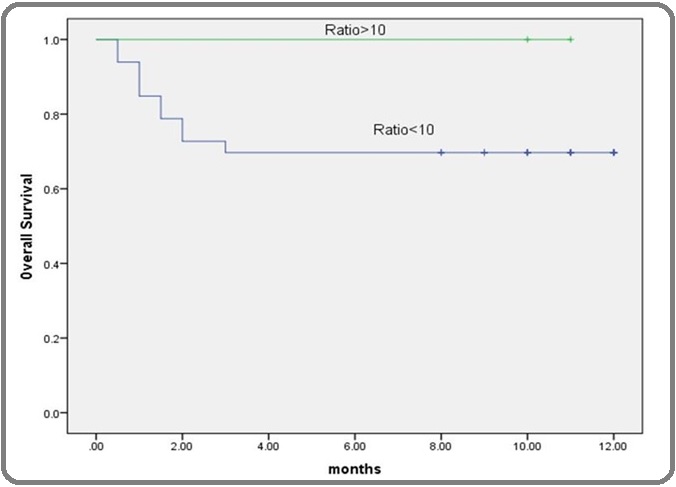
Figure 6: Kaplan-Meier Overall-survival Curve According to PTEN Gene Expression in AML Patients. The Kaplan–Meier overall survival showed that AML patients with very low PTEN gene expression than its corresponding cut-off point (≤0.5) had significantly lower survival those with low levels.
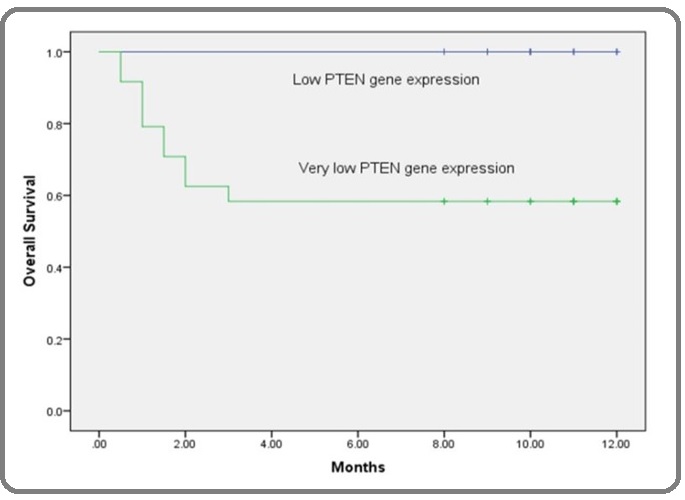
Figure 7: Kaplan-Meier overall-survival Curve According to Serum P53 Concentration (µgm/ml) in AML Patients. Kaplan-Meier survival curve for AML patients revealed that, patients with lower levels of serum P53 than its corresponding cut-off point (≤5 µgm/ml) had shorter overall survival time than patients with higher levels. The difference is statistically significant according to the log rank test (p<0.05).
6. Correlation Studies
6.1. Correlation Between PTEN Gene Expression P53 Concentration And All The Parameters (Table4).
| PTEN gene expression | P53 concentration | |
| Lymphocytes (%) | r=0.730 | r=0.781 |
| P=0.000* | P=0.000* | |
| Monocytes (%) | r=-0.500 | r=-0.527 |
| P=0.002* | P=0.001* | |
| ALC/AMC ratio | r=0.443 | r=0.521 |
| P=0.008* | P=0.001* | |
| Serum Albumin (g/dl) | r= 0.718 | r=0.596 |
| P= 0.000* | P=0.000* | |
| P53 (nmole/ml) | r= 0.672 | - |
| P=0.000* | ||
| PTEN gene expression | - | r= 0.672 |
| P=0.000* | ||
| Hb (g/dl) | r=-0.019 | r=0.008 |
| P= 0.916 | P=0.965 | |
| WBCs (x103/µl) | r=0.168 | r= 0.182 |
| P=0.335 | P=0.296 | |
| RBCs (x106/µl) | r= 0.032 | r=-0.103 |
| P=0.854 | P=0.557 | |
| Platelets (x103/µl) | r=-0.003 | r=-0.029 |
| P=0.984 | P=0.866 | |
| ALC (x109/l) | r=0.166 | r=0.232 |
| P=0.340 | P=0.179 | |
| AMC (x109/l) | r=0.053 | r=0.095 |
| P=0.761 | P=0.588 | |
| Blasts in BM (%) | r=-0.246 | r=-0.398 |
| P=0.154 | P=0.018* | |
| Blasts in peripheral blood (%) | r=0.122 | r=0.122 |
| P=0.484 | P=0.484 |
*ALC/AMC, absolute monocyte count/absolute monocyte count ratio; PTEN, Phosphatase and tensin homolog on chromosome 10; Hb, hemoglobin; WBCs, white blood cells; RBCs, red blood cells; ALC, absolute lymphocyte count; AMC, absolute monocyte count; BM, bone marrow; r, correlation coefficient; *, Statistically significant at p ≤ 0.05
Table (4):Correlation between PTEN gene expression, p53 concentration and all the parameters.
Discussion
The absolute lymphocyte count is a simple yet statistically powerful estimate in patients with acute leukemia [21]. Mando et al., (2018) stated that both T lymphocytes and natural killer (NK) cells can kill tumor cells and that the tumor infiltration by lymphocytes shows immune response against tumor cells which suggests better prognosis [22].
Behl et al., (2006) reported that ALC after induction chemotherapy can predict the survival in AML patients as it is an effective defense against leukemic blasts which agrees with our finding where the mean overall survival of patients with lymphocyte percentage ≤ 25 had a mean overall survival of 6.70 months compared to those with high lymphocyte percentage (>25%) whose mean survival was 10.45 months (χ2 =5.808, P=0.016) [23]. In addition, AML patients with lower levels of ALC had shorter overall survival than patients with higher levels (χ2 =4.587, P= 0.032). This further stresses the role of lymphocytes in patients’ immunity to acute leukemia.
Le Jeune et al., (2014) assessed the prognostic value of ALC among AML patients before and after induction chemotherapy, they found that patients with low initial ALC<1X10⁹/L showed poor prognosis [24].
Regarding the serum albumin level, in the present study AML patients with low serum albumin were of low overall survival compared to those with normal level (χ2 =8.698, P=0.003). This agrees with Girault et al., (2017) who concluded that AML patients with good nutrition had short hospital stays had better survival highlighting the prognostic value of serum albumin [25].
The aberrant expression of CD markers not specific to a certain lineage creates ambiguity for lineage assignment and leukemia diagnosis. Elyamany et al., (2013) reported that aberrant antigen expression indicated poor prognosis and aggressiveness of the disease [26]. Also, Tiftik et al., (2004) reported that CD7 expression at diagnosis among AML patients showed low remission rate which agrees with our findings [27].
In this study, 7/9 patients expressing CD7 died during induction, which agrees with Li et al., (2011) [28]. These patients had the lowest level of serum albumin and a high percentage of bone marrow blasts whereas, they had a low total leukocytic count. Furthermore, these patients had the lowest PTEN and p53 levels reflecting more aggressive nature of the disease. Besides, 2/35 patients had aberrant expression of CD19. These patients’ attained remission from the second cycle indicating poor prognosis and low remission rate which agrees with Momani et al., (2016) who found a significant correlation between the presence of aberrant phenotypes and prediction of
remission in AML patients [29].
As regards to PTEN gene expression, it was significantly lower in AML patients compared to the control group (P=0.000) which agrees with Zayed et al., (2017) but we disagreed with them in that they couldn’t find a significant relation between PTEN expression and overall survival in patients with AML as we did [30].
On the other hand, Wu et al., (2018) didn’t find a significant difference in the level of PTEN protein (measured by ELISA) between the control group and the incomplete remission group illustrating that real time PCR is more accurate and specific than ELISA [31].
Patients with very low PTEN gene expression couldn’t achieve complete remission (CR) from the first cycle, but from the second. Also, a negative correlation was found between PTEN gene expression and bone marrow blasts percentage (r=-0.246, P=0.154) indicating poor prognosis, yet the difference was not significant. Additionally, patients pertaining to very low PTEN expression were expressing CD7 on their blasts and died during induction showing poor survival and indicating bad prognosis as stated above which agrees with Huang et al., (2015) [32]. In agreement with our findings, Salarpour et al., (2017) stated that lower level of p53 cannot inhibit AML neoplastic process [33-34]. In addition, Patients having a very low p53 protein level either died or achieved complete remission after 2 induction cycles while those with higher p53 protein level attained CR after the first
induction cycle.
The significant negative correlation found between p53 protein level and bone marrow blasts (r=-0.398, P=0.018) reflects the aggressiveness of the disease in patients with lower p53 levels as well as loss of myeloid differentiation. The significant negative correlation found between monocyte percentage and p53 level (r= -0.527, P=0.001) indicates also poor prognosis. In contrast, the significant positive correlation found between PTEN gene expression on p53 concentration (r= 0.672, P=0.000) reflects their interrelationship which was hypothesized by Brito et al., (2015) who showed that p53 is an activator of PTEN transcription by binding directly to PTEN promoter region and that PTEN mRNA and protein levels increases in
response to stimuli that result in p53 induction [35].
Additionally, our results confirmed the poor prognostic values of low levels of PTEN and p53 as they were positively correlated with low serum albumin level which is a known prognostic maker of bad omen as stated by Sadrzadeh et al., (2017) [36]. Similarly, Baltz et al., (2016) said that PTEN deficiency is frequently found in patients in the late stages of cancer [37].
In conclusion, Aberrant CD7, CD19 expression, very low expression of PTEN and low level of p53 could predict the unresponsiveness to standard chemotherapy. The positive correlation between p53 level and PTEN gene expression obviates that both pathways are interrelated. The decrease in ALC, lymphocyte percentage, serum albumin concentration and the increase in monocyte percentage indicate bad prognosis in AML patients.
We recommend the following:
1) P53 and PTEN level should be estimated in all AML patients at least at diagnosis to individualize patient’s treatment.
2) The absolute lymphocyte count, lymphocyte percentage and monocyte percentage are simple valuable prognostic markers and should be extrapolated from the CBC.
3) Serum albumin should be measured in AML as a valuable prognostic marker.
4) Flow cytometric determination of aberrant lymphoid
markers (CD7, CD19) should be included in the diagnostic workup of AML patients as they are strong predictors of overall survival and response to treatment.
Acknowledments
This research did not receive any specific grant from funding agencies in the public, commercial and not for profit sectors.
Compliance with ethical standards
The study protocol was approved by the ethical committee of the MRI, Alexandria, Egypt. A signed consent was obtained from all participants before enrollment in the study
Competence of interest
The authors declare no conflict of interest regarding this manuscript
References
- Epigenetic Regulators in the Development, Maintenance, and Therapeutic Targeting of Acute Myeloid Leukemia Sun Younguk, Chen Bo-Rui, Deshpande Aniruddha. Frontiers in Oncology.2018;8. CrossRef
- Acute myeloid leukemia: 2019 update on risk-stratification and management Estey Elihu H.. American Journal of Hematology.2018;93(10). CrossRef
- Cancer Incidence in Egypt: Results of the National Population-Based Cancer Registry Program Ibrahim Amal S., Khaled Hussein M., Mikhail Nabiel NH, Baraka Hoda, Kamel Hossam. Journal of Cancer Epidemiology.2014;2014. CrossRef
- Evidence of mTOR Activation by an AKT-Independent Mechanism Provides Support for the Combined Treatment of PTEN-Deficient Prostate Tumors with mTOR and AKT Inhibitors Zhang Weisheng, Haines Brian B., Efferson Clay, Zhu Joe, Ware Chris, Kunii Kaiko, Tammam Jennifer, Angagaw Minilik, Hinton Marlene C., Keilhack Heike, Paweletz Cloud P., Zhang Theresa, Winter Chris, Sathyanarayanan Sriram, Cheng Jonathan, Zawel Leigh, Fawell Stephen, Gilliland Gary, Majumder Pradip K.. Translational Oncology.2012;5(6). CrossRef
- Phosphatase and Tensin Homolog (PTEN) Represses Colon Cancer Progression through Inhibiting Paxillin Transcription via PI3K/AKT/NF-κB Pathway Zhang Ling-Li, Mu Gang-Gang, Ding Qian-Shan, Li Yan-Xia, Shi Yun-bo, Dai Jin-Fen, Yu Hong-Gang. Journal of Biological Chemistry.2015;290(24). CrossRef
- The functions and regulation of the PTEN tumour suppressor Song Min Sup, Salmena Leonardo, Pandolfi Pier Paolo. Nature Reviews Molecular Cell Biology.2012;13(5). CrossRef
- Promoter Methylation and Loss of Expression of PTEN Gene in Breast Cancer Patients from Saudi Population Alam M S, Jerah A B, Ashraf J M, Kumaresan K , Eisa Z M, Mikhail N T. J Clin Exp Oncol.2017;6:6.
- PI3K mutations in breast cancer: prognostic and therapeutic implications Mukohara Toru. Breast Cancer: Targets and Therapy.2015. CrossRef
- Tetramer formation of tumor suppressor protein p53: Structure, function, and applications Kamada Rui, Toguchi Yu, Nomura Takao, Imagawa Toshiaki, Sakaguchi Kazuyasu. Biopolymers.2016;106(4). CrossRef
- mTOR Cross-Talk in Cancer and Potential for Combination Therapy Conciatori Fabiana, Ciuffreda Ludovica, Bazzichetto Chiara, Falcone Italia, Pilotto Sara, Bria Emilio, Cognetti Francesco, Milella Michele. Cancers.2018;10(1). CrossRef
- The non-genomic loss of function of tumor suppressors: an essential role in the pathogenesis of chronic myeloid leukemia chronic phase Crivellaro Sabrina, Carrà Giovanna, Panuzzo Cristina, Taulli Riccardo, Guerrasio Angelo, Saglio Giuseppe, Morotti Alessandro. BMC Cancer.2016;16(1). CrossRef
- Mutant p53 in Cancer: New Functions and Therapeutic Opportunities Muller Patricia A.J., Vousden Karen H.. Cancer Cell.2014;25(3). CrossRef
- Targeting acute myeloid leukemia stem cell signaling by natural products Siveen Kodappully Sivaraman, Uddin Shahab, Mohammad Ramzi M.. Molecular Cancer.2017;16(1). CrossRef
- Time to repeal and replace response criteria for acute myeloid leukemia? Bloomfield Clara Derber, Estey Elihu, Pleyer Lisa, Schuh Andre C., Stein Eytan M., Tallman Martin S., Wei Andrew. Blood Reviews.2018;32(5). CrossRef
- Basic haematological techniques. In: Bain BJ, Bates I, Alaffan M, Lewis SM (eds) Carol B, Bain BJ. Dacie and Lewis practical haematology 11th ed. London: Churchill Livingstone .2012;:23-56.
- Immunophenotyping. I n: Bain B, Bates I, Laffian MA, Leis S. (eds). Dacie and Lewis practical hematology. 11 th ed Matuets E, Morilla R, Morilla AM. Germany: Elsevier Ltd.2011;:353-362.
- Bone marrow biobsy. In: Bain BJ, Lewis SM, Bates I (eds). Dacie and Lewis practical hematology. 11th ed Bates I, Burthem J. Philadelphia: Churchill livingstone/Elsevier.2011;:123-137.
- Bone Marrow Aspiration and Biopsy Malempati Suman, Joshi Sarita, Lai Susanna, Braner Dana A.V., Tegtmeyer Ken. New England Journal of Medicine.2009;361(15). CrossRef
- Cigarette smoke-induced differential gene expression in blood cells from monozygotic twin pairs Leeuwen D. M.v., Agen E. v., Gottschalk R. W.H., Vlietinck R., Gielen M., Herwijnen M. H.M.v., Maas L. M., Kleinjans J. C.S., Delft J. H.M.v.. Carcinogenesis.2006;28(3). CrossRef
- A simple guide to IBM SPSS statistics for version 21.0. Student ed Kirkpatrick LA, Feeney BC. Belmont, Calif.: Wadsworth, Cengage Learning.2013.
- Prognostic factors for acute myeloid leukaemia in adults - biological significance and clinical use Liersch Ruediger, Müller-Tidow Carsten, Berdel Wolfgang E., Krug Utz. British Journal of Haematology.2014;165(1). CrossRef
- High neutrophil to lymphocyte ratio and decreased CD69+NK cells represent a phenotype of high risk in early-stage breast cancer patients Mandó Pablo, Rizzo Manglio, Roberti María Paula, Juliá Estefanía, Pampena María Betina, Pérez de la Puente Constanza, Loza Carlos Martín, Ponce Carolina, Nadal Jorge, Coló Federico Andres, Mordoh José, Levy Estrella. OncoTargets and Therapy.2018;Volume 11. CrossRef
- Absolute lymphocyte count recovery after induction chemotherapy predicts superior survival in acute myelogenous leukemia Behl D, Porrata L F, Markovic S N, Letendre L, Pruthi R K, Hook C C, Tefferi A, Elliot M A, Kaufmann S H, Mesa R A, Litzow M R. Leukemia.2005;20(1). CrossRef
- Initial absolute lymphocyte count as a prognostic factor for outcome in acute myeloid leukemia Le Jeune Caroline, Bertoli Sarah, Elhamri Mohamed, Vergez Francois, Borel Cecile, Huguet Françoise, Michallet Mauricette, Dumontet Charles, Recher Christian, Thomas Xavier. Leukemia & Lymphoma.2013;55(4). CrossRef
- Assessment of the nutritional status of adult patients with acute myeloid leukemia during induction chemotherapy Deluche Elise, Girault Stephane, Jesus Pierre, Monzat Sophie, Turlure Pascal, Leobon Sophie, Abraham Julie, Daly Nathalie, Dauriac Olivia, Bordessoule Dominique. Nutrition.2017;41. CrossRef
- Abnormal expression of CD79a, CD56 and CD7 in acute myeloid leukemia Elyamany G, Fadalla K, Abdulaaly A. Pathology Discovery.2013;1:6.
- The importance of CD7 and CD56 antigens in acute leukaemias Tiftik N., Bolaman Z., Batun S., Ayyildiz O., Isikdogan A., Kadikoylu G., Muftuoglu E.. International Journal of Clinical Practice.2004;58(2). CrossRef
- Relevance of immunophenotypes to prognostic subgroups of age, WBC, platelet count, and cytogenetics in de novo acute myeloid leukemia LI XIAOQING, LI JUAN, DU WEN, ZHANG JIAHUA, LIU WEI, CHEN XIANGJUN, LI HONGRUI, HUANG SHIANG, LI XIN. APMIS.2010;119(1). CrossRef
- Aberrant Antigen Expression in Patients with Acute Leukemias; Experience of King Hussein Medical Center in Jordan Momani A, Abbasi N, Alsokhni H, Habahbeh L, Khasawneh R, Kamal N. JRMS.2016;23(2):59-67.
- MN1 and PTEN gene expression in acute myeloid leukemia Zayed Rania A., Eltaweel Maha A., Botros Shahira K.A., Zaki Mohamed A.. Cancer Biomarkers.2017;18(2). CrossRef
- Expression and clinical significance of serum MMP‑7 and PTEN levels in patients with acute myeloid leukemia Wu Jiang, Song Yu. Oncology Letters.2018. CrossRef
- Prognostic value of the expression of phosphatase and tensin homolog and CD44 in elderly patients with refractory acute myeloid leukemia HUANG XIAO, LI DONGYUN, LI TIANTIAN, ZHAO BO, CHEN XINYI. Oncology Letters.2015;10(1). CrossRef
- Roles of AML1/RUNX1 in T-cell malignancy induced by loss of p53 Shimizu Kimiko, Yamagata Kazutsune, Kurokawa Mineo, Mizutani Shuki, Tsunematsu Yukiko, Kitabayashi Issay. Cancer Science.2013;104(8). CrossRef
- Changes of AML 1 and P53 tumor suppressor gene expression in patients denovo acute myeloid leukemia Salarpour F, Goudarzipour K, Ahmadzadeh , Hossein MM, Farsani MA. JPS .2017;8(1):39-45.
- Focus on PTEN regulation Bermúdez Brito Miriam. Frontiers in Oncology.2015;5. CrossRef
- The prognostic role of serum albumin in patients receiving induction chemotherapy for acute myeloid leukemia (AML) Sadrzadeh H, Brunner AM, Drapkin BJ, Babirak L, Werner L, Ballen KK. J Clin Oncol .2017;:6618.
- JQ1, a Potential Therapeutic Molecule for Myeloid Leukemia with PTEN Deficiency Baltz NJ, Colorado NC, Yan Y, Lensing S, Robinson D, Cottler-Fox MH, et al . Blood .2016;128(22):5899.
License

This work is licensed under a Creative Commons Attribution-NonCommercial 4.0 International License.
Copyright
© Asian Pacific Journal of Cancer Biology , 2020
Author Details