Effect of Different Dose Rates on Dosimetric Parameters and Accuracy of the Pretreatment Quality Assurance During Intensity-modulated Radiotherapy Planning Using Anthropomorphic Phantom
Download
Abstract
Background: This study investigates the impact of varying dose rates on dosimetric parameters and pretreatment quality assurance (QA) accuracy in intensity-modulated radiotherapy (IMRT) planning using anthropomorphic phantoms. The research explores the dosimetric effects of different dose rates ranging from 100 to 600 monitor units per minute (MU/min) on parameters such as Homogeneity Index (HI), Conformity Index (CI), and dose to organs at risk (OAR).
Method: Anthropomorphic phantoms, mimicking human tissues, were employed for simulation. Treatment plans were generated using the Eclipse Treatment Planning System, and dosimetric evaluations were conducted using cumulative dose-volume histograms (DVH). Furthermore, pretreatment patient-specific QA was performed using EPID portal dosimetry and Delta4 dosimetry system.
Result: Treatment plans adhere to institutional protocol, ensuring the target receives ≥95% of the prescription dose while meeting OAR constraints. All plans maintain target homogeneity and conformality, keeping maximum doses within the target below 107%. Low dose plans exhibit superior target coverage, conformality, and homogeneity compared to higher doses. However, increased dose rates elevate delivered Monitor Units and maximum doses to critical structures. Gamma passing rates vary with dose rates, with the lowest at 100 MU/min and the highest at 400 MU/min for 1% 1mm criteria. Dosimetric evaluations using Delta 4 and EPID QA methods confirm plan validity across different dose rates.
Conclusion: Low dose rate dosimetry is superior to higher rates for target and organ-at-risk (OAR) delivery, albeit prolonging delivery time and affecting internal organ motion. Portal dosimetry offers a faster, more convenient tool for IMRT pretreatment quality assurance (QA). Optimal results are achieved at 400 MU/min, enhancing gamma agreement between calculated and measured portal doses for complex fields. This improvement in QA enhances IMRT treatment delivery quality. However, patient-specific QA using the DELTA4 dosimetry system and ICRU 83 recommendations are insufficient for discussing dosimetric differences relevant to patient treatment.
Introduction
Intensity-modulated radiation Therapy (IMRT) addresses non-uniform radiation patterns by varying beam intensity from multiple directions, enhancing tumour dose homogeneity and conformity, especially for complex targets. Unlike conventional methods, IMRT optimizes absorbed-dose distribution by adjusting beam intensity within segments. Enabled by high-performance computers, the “inverse treatment planning” iteratively determines optimal beam shapes and fluence patterns based on desired outcomes. Though labelled “optimized planning,” IMRT does not guarantee an objectively optimal solution, as it compromises goals [1].
RapidArc, by Varian Medical Systems, is a clinically approved volumetric-modulated arc therapy technique introduced in 2008. It achieves precise 3D dose distribution through a 360° gantry rotation, simultaneously varying gantry speed, multileaf collimator movement, and delivery dose rate. This enhances conformal dose distributions, improving target coverage while sparing normal tissues compared to conventional radiotherapy. RapidArc also has the potential for reduced treatment time and fewer monitor units compared to static field intensity-modulated radiotherapy [2-4].
A wide range of dose rates has been used in radiotherapy, extending from a few rads per day to thousands of rads in a fraction of a second. At ultra-high dose rates (pulses of micro or nanoseconds), an apparent dose-rate effect has been demonstrated for bacteria but is less specific for mammalian cells; these dose rates have no particular application in radiotherapy. The principal dose-rate effect is observed between 100 rads/minute and 10 rads/hour; the cell-killing effect of X or γ rays decreases continuously as the dose-rate decreases throughout this range and may be explained readily in terms of the repair of sub-lethal damage taking place during the irradiation. At lower dose rates, cell proliferation continues during the irradiation, and the outcome is a complex function of cellular radiosensitivity, dose/cell cycle and tissue adaptability [5].
In clinical radiotherapy, the traditional pattern of high dose rate for external beam therapy and low dose rate for intracavitary and interstitial treatment has been challenged in recent years. The cathetron has made using a high dose-rate fractionated regime possible for the intracavitary treatment of carcinoma of the cervix and surface mould applications. Conversely, beam therapy at a low dose rate (100 rads/hour) has been proposed and introduced recently to combine radium’s allegedly superior results with the safety and convenience of a beam therapy set-up [6].
The objective of this study was to evaluate the impact of radiation dose rate on dosimetric parameters such as Homogeneity Index (HI), Conformity Index (CI), dose to organs at risk (OAR) and the pretreatment patient specific Quality Assurance of dynamic IMRTdose delivery, as measured using Delta4 and EPID using six dose rates 100, 200, 300, 400, 500 and 600 MU/min.
Materials and Methods
The study was approved by Institutional Ethics Committee; BBCI Medical Ethics Committee (Registration No: ECR/1040/Inst/AS/2018). Anthropomorphic phantoms, mimicking human tissues, are versatile medical imaging and radiation therapy tools. They substitute for patients in tasks like testing radiation protocols, refining imaging techniques, and training staff. Advancements in 3D printing enhance their realism, aiding in the development of improved phantoms for more accurate simulations.
CT images of the anthropometric phantom were acquired in the Philips Brilliance big bore CT (Phillips Medical Systems Nederland B.V. Veenpluis, The Netherlands) machine according to standard procedures with 3-mm slice spacing.
Contouring
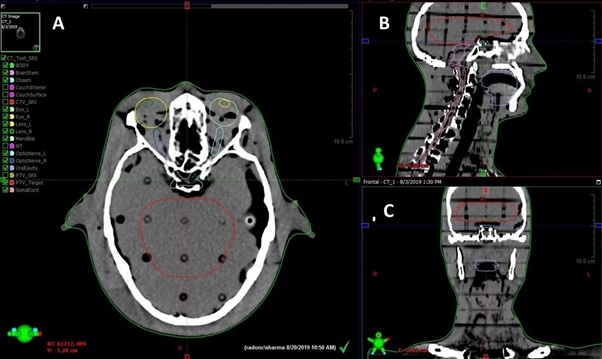
Planning target volume (PTV) t and OARs were delineated according to the ICRU report 83 [7]. The OARs, including the Right lens, Left lens, Right eye, Left eye, right optic nerve, left optic nerve, Optic chiasm, Brainstem, Oral Cavity, Mandible and Spinal Cord, were outlined. All the targets and OARs were outlined slice by slice of the CT image in the treatment planning system and automatically reconstructed the three-dimensional contour (Figure 1).
Figure 1. Target and Organ at Risk Contouring: (A) Axial View, (B) Sagittal View, (C) Coronal View .

The planning CT images were then loaded into the Eclipse Treatment Planning System (version 15.6) for treatment planning.
Planning
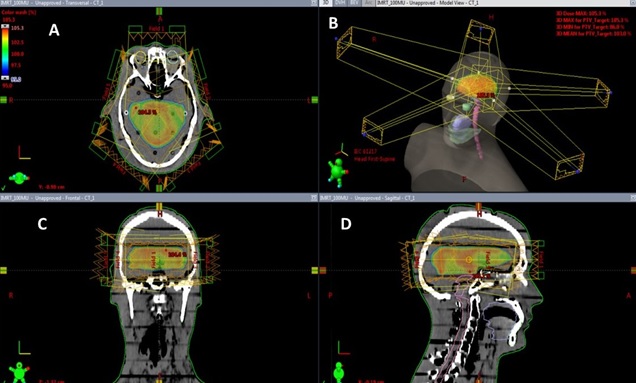
For intensity-modulated radiotherapy, treatment plans were generated using the Eclipse Version 15.6 treatment planning system using 6 MV for linear accelerator and 120-leaf multileaf collimator (MLC) (5-mm width leaves over target extent). The final dose calculations were performed using the AAA Algorithmin Eclipse. The IMRT plan set used five beams (0°, 72°, 144°, 216°, 288°) that were isocentrically centered on the target (Figure 2) and achieved at least 100% coverage of PTV with the 95% isodose 60 Gy without violating OAR maximum dose constraints.
Figure 2. IMRT Planning Beam Arrangements (A) Axial View, (B) Beams Eye View, (C) Coronal View (D) Sagittal View .

The DVH calculations were also performed in Eclipse. The PTV was prescribed to 50Gy (D50%), and the optimization constraints that ensure a 95% isodose line encompasses 95% of PTV (V95%≥47.5Gy).
Planning Objectives
The PTV was prescribed to 50Gy (D50%), and the optimization constraints that ensure a 95% isodose line encompasses 95% of PTV (V95%≥47.5Gy). Table 1 shows various planning objectives for the IMRT plan.
| Structure | Planning Objecting |
| PTV | V5820cGy ≥ 97%, |
| V6240cGy ≤ 0cc | |
| Right lens Dmax | 6-8 Gy |
| Left lens Dmax | 6-8 Gy |
| Right eye Dmax | 40 Gy |
| Left eye Dmax | 40 Gy |
| Right optic nerve Dmax | 54 Gy |
| Left optic nerve Dmax | 54 Gy |
| Optic chiasm Dmax | 54 Gy |
| Brainstem Dmax | 54 Gy |
| Mandible Dmax | 54 Gy |
| Spinal cord Dmax | 45 Gy |
Plan Evaluation and Dosimetric Data
Cumulative dose–volume histograms (DVH) were calculated for each plan to evaluate plans quantitatively. For PTV, the values of D98 and D2% (dose received by the 98 and 2% of the volume, respectively) were defined as metrics for minimum and maximum doses and consequently reported. V57Gy represents the volume receiving 57Gy, i.e. 95% of prescribed dose (V95%).
The conformity index (CI) and homogeneity index (HI)were defined to describe the quality of plans as follows: The CI of the PTV was defined as [8]:
C.I. =V57Gy/PTV
To determine the target dose uniformity in the target volume, the HI tool was used and is calculated as follows: [9]
HI= (D2%-D98%)/D50%
Patient-Specific Quality Assurance-
IMRT treatment plans of phantom consisting of five IMRT fields, each calculated at six different dose rates: 100, 200, 300, 400, 500 and 600 MU/min dose rates were analyzed. For all six IMRT plans, pretreatment QA using EPID and Delta4 was performed.
EPID Portal Dosimetry
This study used Varian’s amorphous silicon (aSi) indirect detection EPID on the Varian Trilogy Linear Accelerator for EPID image analysis. The 1000 flat panel EPID has a 40 × 30 cm2 detecting surface with 1024 × 768 pixels. ARIA integration system (v8.8) and Varian’s portal dosimetry system were employed. EPID calibration was performed quarterly as per the vendor’s specifications and configured for IMRT absolute dose measurements. Verification plans were created in Eclipse TPS, and portal dose images were calculated and measured at 0° gantry angle. Gamma evaluation was performed between EPID images and portal dose prediction images in the ARIA integration system [10].
Delta4 Patient Specific QA
Phantom density in the TPS was set to 1.147 relative to water, and the dose was calculated. ACPDP reconstruction on a PMMA phantom compared ACPDP and TPS 3D grids to Delta4 measured dose. Volumetric doses were also compared to the D4 Interpolation 3D dose grid using γ-analysis (3%/3mm and 2%/2mm thresholds). Dose points below 10% of the max dose were excluded. 3D γ-analysis was conducted in Delta4 software. Representative dose profiles were exported to highlight areas of disagreement [11].
Evaluation of patients specific QA
Gamma (γ) evaluation quantitatively compares dose distributions, considering both dose and spatial differences. It includes dose difference and distance-to- agreement (DTA) tests in different dose gradient regions. The evaluation between portal dose prediction and acquired portal dose images used three scalar parameters: maximum gamma (γmax), average gamma (γavg), and percentage of the field area with gamma >1.0 (γ% >1), with 3% dose to 3 mm distance criteria. Lower gamma values indicated better agreement. A 1.0 cm extension around treatment field sizes was considered, covering portal detectors. Viewer options in the portal dosimetry workspace enable users to define tolerance values, apply display settings, and specify evaluation criteria and regions of interest [12].
Results and Discussion
Clinical Planning
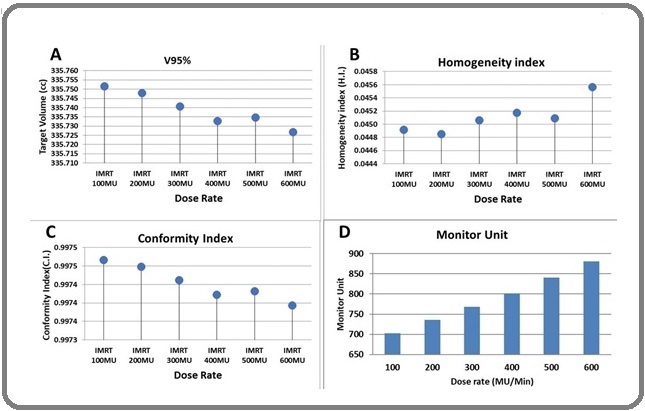
Coverage of the treatment target of different plans is achieved according to institutional protocol, with the whole target receiving at least 95% of the prescription dose. All plans were able to meet the constraints placed on the OAR and Targets. All plans were optimized to keep the maximum dose within the target to <107% (hot spot) of the prescription dose (Dmax< 107%), and all the plans were able to meet this objective such as target coverage, conformality, and homogeneity. Target coverage of target, conformality index, and homogeneity index is better in low doses than at higher doses. The delivered Monitor Unit gradually increases with an increased dose rate. When the treatment delivery dose rate is increased, maximum doses to the Brainstem, Right & Left Eye, Right & Left Eye Lens, Right & Left Optics Nerve, Chiasm, Mandible and Oral Cavity with different dose rates were increased. These complete dosimetric parameters are depicted in Figure 3 and Table 2.
Figure 3. (A) Coverage of Target, (B) Homogeneity Index, (C) conformity Index, and (D) Monitor unit with different dose rate.

| Dosimetric Parameters | Dose Rate (MU/min) | |||||
| 100 | 200 | 300 | 400 | 500 | 600 | |
| D98 (cGy) | 5938.7 | 5936.5 | 5931.4 | 5928.3 | 5922.2 | 5918.2 |
| D2 (cGy) | 6227.7 | 6226.7 | 6224.8 | 6220.7 | 6217.5 | 6215.1 |
| D50 (cGy) | 6162 | 6161 | 6159 | 6155.4 | 6154 | 6149.8 |
| V95% (cc) | 335.19 | 335.18 | 335.15 | 335.15 | 335.1 | 335.08 |
| V107% (cc) | 0 | 0 | 0 | 0 | 0 | 0 |
| HI | 0.0469 | 0.0471 | 0.04764 | 0.0475 | 0.04799 | 0.04828 |
| CI | 0.99581 | 0.99579 | 0.9957 | 0.99569 | 0.99553 | 0.99548 |
| Monitor Unit (MU) | 703 | 736 | 768 | 801 | 840 | 881 |
| Right lens Dmax (cGy) | 696.2 | 698.4 | 701 | 705.3 | 717.6 | 722.7 |
| Left lens Dmax (cGy) | 696.2 | 699.3 | 702.8 | 710.2 | 709 | 712.8 |
| Right eye Dmax (cGy) | 1513.7 | 1516.9 | 1532 | 1541 | 1540.6 | 1546.3 |
| Left eye Dmax (cGy) | 1516.6 | 1521.1 | 1527.2 | 1540.4 | 1543.6 | 1552 |
| Right optic nerve Dmax (cGy) | 1539.3 | 1544.8 | 1556.4 | 1566.4 | 1568 | 1575.1 |
| Left optic nerve Dmax (cGy) | 1432.2 | 1441.3 | 1457.4 | 1478 | 1469.2 | 1480.4 |
| Optic chiasm Dmax (cGy) | 4017 | 4017.3 | 4017.5 | 4018.6 | 4020.5 | 4020.8 |
| Brainstem Dmax (cGy) | 4972 | 4975.3 | 4973 | 4975.9 | 4976.7 | 4979.1 |
| Oral cavity Dmax (cGy) | 124.2 | 124.2 | 124.4 | 124.6 | 125 | 125.2 |
| Spinal cord Dmax (cGy) | 225.7 | 225.8 | 226 | 226.2 | 226.4 | 226.6 |
| Mandible Dmax (cGy) | 61.3 | 61.3 | 61.4 | 61.6 | 61.7 | 61.8 |
Patient-Specific QA
From the measurement of the IMRT plan having different dose rates, it was seen that the Gamma passing rates with 1% 1mm had the lowest gamma value of 20.2% at 100 MU/min and the highest value of 26.1 at 400 MU/min. For 2% 2mm, the lowest gamma value was 46.5 at 200 MU/min, and the highest value was
50.2 at 300 MU/min. For 3% 3mm, the lowest gamma value was 63.6 at 500 MU/min, and the highest value was 66.9 at 300 MU/min. For 4% 4mm, the lowest value was 74.4 at 100 MU/min and 500 MU/min, respectively, and the highest value was 75.9 at 300 MU/min. For 5% and 5mm, the lowest value was 80.4 at 500 MU/min, and the highest was 81.7 at 200 MU/min. Dosimetric comparisons of different plans using Delta 4 and EPID QA are shown Table 3 and Table 4, respectively.
| Dose rate (MU/min) | Criteria | Dose Deviation (%) | Distance To Agreement (DTA) | Gamma index (%) |
| 100 | 1%,1mm | 20.2 | 50.5 | 57.6 |
| 2%,2mm | 46.5 | 77.3 | 86 | |
| 3%,3mm | 63.7 | 87.7 | 96.3 | |
| 4%,4mm | 74.4 | 90.3 | 99.3 | |
| 5%,5mm | 81.2 | 91.2 | 100 | |
| 200 | 1%,1mm | 20.9 | 52.1 | 61.6 |
| 2%,2mm | 48.7 | 73.6 | 86.6 | |
| 3%,3mm | 65.2 | 84.5 | 96.3 | |
| 4%,4mm | 75.4 | 88.4 | 99.3 | |
| 5%,5mm | 81.7 | 90.1 | 100 | |
| 300 | 1%,1mm | 22.7 | 55.1 | 58.6 |
| 2%,2mm | 50.2 | 79.7 | 88.8 | |
| 3%,3mm | 66.9 | 84.2 | 97.1 | |
| 4%,4mm | 75.9 | 89.1 | 99.3 | |
| 5%,5mm | 81.2 | 90.4 | 100 | |
| 400 | 1%,1mm | 26.1 | 50.8 | 53.8 |
| 2%,2mm | 49 | 72.8 | 86.1 | |
| 3%,3mm | 65.6 | 83.6 | 95.9 | |
| 4%,4mm | 75.3 | 88.9 | 99.3 | |
| 5%,5mm | 81.1 | 90.2 | 99.9 | |
| 500 | 1%,1mm | 24.9 | 50.8 | 56.5 |
| 2%,2mm | 47.5 | 72.8 | 85.3 | |
| 3%,3mm | 63.6 | 82.6 | 95.7 | |
| 4%,4mm | 74.4 | 88.2 | 99.3 | |
| 5%,5mm | 80.4 | 89.5 | 99.9 | |
| 600 | 1%,1mm | 25.5 | 51 | 60.2 |
| 2%,2mm | 48.3 | 72.2 | 85.7 | |
| 3%,3mm | 65.3 | 82.7 | 95.6 | |
| 4%,4mm | 74.9 | 87.9 | 99.3 | |
| 5%,5mm | 81.1 | 89.5 | 99.9 |
| Dose rate (MU/min) | Criteria | Max. Dose Difference | Maximum Gamma | Area Gamma | ||
| <1.0 | >0.8 | > 1.2 | ||||
| 100 | 1%,1mm | 0.5 | 3.37 | 81.1 | 34.2 | 9.8 |
| 2%,2mm | 0.5 | 1.69 | 99.5 | 2.6 | 0.2 | |
| 3%,3mm | 0.5 | 1.12 | 100 | 0.2 | 0 | |
| 4%,4mm | 0.5 | 0.84 | 100 | 0 | 0 | |
| 5%,5mm | 0.5 | 0.67 | 100 | 0 | 0 | |
| 200 | 1%,1mm | 0.32 | 3.72 | 66.5 | 46.7 | 21.2 |
| 2%,2mm | 0.32 | 1.86 | 97.9 | 7.4 | 0.6 | |
| 3%,3mm | 0.32 | 1.24 | 99.9 | 0.6 | 0 | |
| 4%,4mm | 0.32 | 0.93 | 100 | 0.1 | 0 | |
| 5%,5mm | 0.32 | 0.74 | 100 | 0 | 0 | |
| 300 | 1%,1mm | 0.67 | 3.47 | 64.3 | 51.6 | 20.1 |
| 2%,2mm | 0.67 | 1.74 | 98.5 | 6.8 | 0.2 | |
| 3%,3mm | 0.67 | 1.16 | 100 | 0.2 | 0 | |
| 4%,4mm | 0.67 | 0.87 | 100 | 0 | 0 | |
| 5%,5mm | 0.67 | 0.69 | 100 | 0 | 0 | |
| 400 | 1%,1mm | 0.72 | 3.71 | 68.4 | 47.4 | 17.3 |
| 2%,2mm | 0.72 | 1.85 | 98.5 | 6.1 | 0.3 | |
| 3%,3mm | 0.72 | 1.24 | 100 | 0.3 | 0 | |
| 4%,4mm | 0.72 | 0.93 | 100 | 0 | 0 | |
| 5%,5mm | 0.72 | 0.74 | 100 | 0 | 0 | |
| 500 | 1%,1mm | 0.77 | 3.71 | 68.9 | 46.7 | 16.8 |
| 2%,2mm | 0.77 | 1.85 | 98.5 | 6.2 | 0.3 | |
| 3%,3mm | 0.77 | 1.24 | 100 | 0.3 | 0 | |
| 4%,4mm | 0.77 | 0.93 | 100 | 0 | 0 | |
| 5%,5mm | 0.77 | 0.74 | 100 | 0 | 0 | |
| 600 | 1%,1mm | 0.74 | 3.69 | 69.9 | 45.5 | 16.2 |
| 2%,2mm | 0.74 | 1.84 | 98.6 | 6 | 0.3 | |
| 3%,3mm | 0.74 | 1.23 | 100 | 0.3 | 0 | |
| 4%,4mm | 0.72 | 0.92 | 100 | 0 | 0 | |
| 5%,5mm | 0.74 | 0.74 | 100 | 0 | 0 |
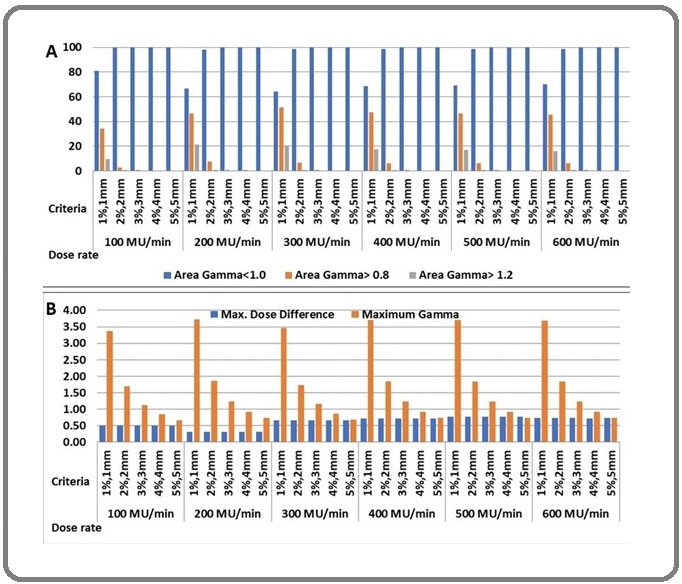
Similarly, the column chart of QA data comparison of varying dose rates for Delta4 and EPID are depicted in Figure 4 (a) and (b), respectively.
Figure 4. Comparison Column Chart – (a) Delta4 QA Data and (b) EPID QA Data for Six Different Dose Rates .

In conclusion, low dose rate dosimetric parameters are comparatively better than higher dose rate delivery in target and OARs. Meanwhile, delivery duration is extended in a low dose rate, affecting internal organ movement.
Portal dosimetry provides a tool for routine pretreatment QA of IMRT treatments that is potentially and significantly faster and more convenient. This study analyzed the impact of dose rate in the dynamic IMRT pretreatment verification QA fields using portal dosimetry. Based on the data, it can be concluded that 400 MU/min is optimum and lowering the dose rate helps to get an enhanced gamma agreement between the calculated and measured portal doses of complicated fields. This may be attributed to the less complex motion of MLC over time and the MU of the field/segment. The improvement in gamma agreement leads to an increase in IMRT treatment delivery quality. An IMRT QA workflow was created, which will help improve the quality of IMRT delivery.
Patient-specific QA with the DELTA 4 dosimetry system, using the evaluation limited to the diode measurement points, and the ICRU 83 recommendations for assessment cannot be used to discuss differences between planned and measured doses of dosimetric relevance for the treatment of the patient.
Acknowledgements
Statement of Transparency and Principals:
Author contribution
All authors contributed to the conception or design of the work, and the acquisition, analysis, or interpretation of the data. All authors were involved in drafting and commenting on the paper and have approved the final version.
References
- Intensity modulated radiation therapy: A review of current practice and future outlooks Rehman J, Syed Z, Ahmad N, Khalid M, Noor H, Asghar H, Gilani Z, et al . 2020.
- Volumetric modulated arc therapy: IMRT in a single gantry arc Otto K. Medical Physics.2008;35(1). CrossRef
- Single-Arc IMRT? Bortfeld T, Webb S. Physics in Medicine and Biology.2009;54(1). CrossRef
- Commissioning of volumetric modulated arc therapy (VMAT) Bedford JL , Warrington AP . International Journal of Radiation Oncology, Biology, Physics.2009;73(2). CrossRef
- Radiation dose-rate: a factor of importance in radiobiology and radiotherapy Hall EJ . The British Journal of Radiology.1972;45(530). CrossRef
- Key changes in the future clinical application of ultra-high dose rate radiotherapy Lin B, Fan M, Niu T, Liang Y, Xu H, Tang W, Du X. Frontiers in Oncology.2023;13. CrossRef
- Der ICRU-report 83: Verordnung, Dokumentation und Kommunikation der Fluenzmodulierten Photonenstrahlentherapie (IMRT) Hodapp N. Strahlentherapie und Onkologie.2012 Jan;188(1):97-100.
- Radiation Therapy Oncology Group: radiosurgery quality assurance guidelines Shaw E., Kline R., Gillin M., Souhami L., Hirschfeld A., Dinapoli R., Martin L.. International Journal of Radiation Oncology, Biology, Physics.1993;27(5). CrossRef
- Prescribing, Recording, and Reporting Photon-Beam Intensity-Modulated Radiation Therapy (IMRT) H.G. Menzel . J. ICRU.2010;10:1-106.
- Investigating the Electronic Portal Imaging Device for Small Radiation Field Measurements Agarwal A, Rastogi N, Maria Das KJ , Yoganathan SA , Udayakumar D, Kumar S. Journal of Medical Physics.2017;42(2). CrossRef
- Characterization and clinical evaluation of a novel IMRT quality assurance system Sadagopan R, Bencomo JA , Martin RL , Nilsson G, Matzen T, Balter PA . Journal of Applied Clinical Medical Physics.2009;10(2). CrossRef
- Evaluation of the gamma dose distribution comparison method Low DA , Dempsey JF . Medical Physics.2003;30(9). CrossRef
License

This work is licensed under a Creative Commons Attribution-NonCommercial 4.0 International License.
Copyright
© Asian Pacific Journal of Cancer Care , 2024
Author Details
How to Cite
- Abstract viewed - 0 times
- PDF (FULL TEXT) downloaded - 0 times
- XML downloaded - 0 times