Cancer Atlas Project–Haryana: Insights for Healthcare Planners
Download
Abstract
Objective: A comprehensive coordinated effort was undertaken by National Cancer Registry Programme (NCRP) and its coordinating unit in an Indian State – Haryana, to map cancer incidence, to provide regional overview of geographical patterns of Cancer within state of Haryana to serve as basis for informing public and policy makers.
Methods: Information on new cases, residents of Haryana state, and diagnosed with cancer during years 2016 -17 was collected from several medical set-ups in 21 districts across Haryana and its neighboring states. Data received from Hospitals registered under NCRP was also included. Age-Adjusted incidence Rates (AARs) were calculated by gender and site for each district in State. All districts were used for comparison of AARs with rates to those from established population based cancer registries. Cumulative risk of developing cancer was calculated.
Results: Data from 36736 cases was collated. Comparison of AARs revealed that there are high incidence rates of head and neck cancers in males, whereas cancer breast was leading site in females. Relative proportions of cancers of sites associated with use of tobacco, were found high in some semi-urban districts of state. Project has recognized and substantiated need of setting up of screening programmes and Population Based Cancer Registry in Haryana. The study was done using an electronic data-capture methodology which is remarkably cost-effective and provides a model for health informatics in setting of developing country.
Conclusion: Contiguous areas of high incidence of cancer recorded in state have shown higher rates of tobacco related cancers (Head & Neck, Lung) necessitating rigorous control on tobacco usage. Higher incidence of certain cancers associated with reproductive system of both men (prostate) and women (cervix and breast) implicates factors such as lifestyle changes due to urbanization. Overall, the project is a step towards good cancer statistics availability in the country.
Introduction
Non Communicable Diseases have globally recorded an increasing burden. Sudden surges of infectious diseases (pandemics) also lead to rise in morbidity as well as mortality in those having co-existing NCDs. For cancer, it is estimated that four-fifths of burden of estimated 20 million new cases across the globe in year 2025 would be borne by low and middle income countries [1]. To provide an unbiased profile of cancer scenario, a request to governments of nations to record cancer incidence by type of cancer per 100,000 population was initiated in world health assembly [1]. Investigating geographic variation of cancer incidence is also essential, to analyze patterns of cancer incidence, so that existing gaps in providing efficient effective health services are identified and filled.
Cancer Epidemiology has evolved in a scientific manner by studying distribution of cancers across various geographical areas. Rates of occurrences so recorded not only give a pointer towards risk but also give etiology of disease. Maps use numerical value to bring out true picture of variable in demarcated geographic area making it comparable to another map similarly drawn for the variable.
Cancer atlas is a geographical representation of cancer incidence and/or mortality on thematic maps that visually describes cancer status of a state, a country or of a group of countries. Thematic map focuses on displaying geographic occurrence and variation of a single phenomenon. Atlases of cancer incidence, noteworthy across the world are Cancer Atlas – Australia [2], Scotland [3] and Nordic countries [4].
India is a vast country comprising of 28 states and 8 Union Territories, with distribution of population which is dense in some areas and sparse in others. Diversity in practices of cultures and dietary habits are evident so also is urban and rural distribution within same area. Rapid urbanization in parts of states has brought about changes in lifestyles.
Haryana has a population of 25.4 million (almost that of Australia) of which 65.1% comprises rural and 34.9% is urban population [5]. Effort in this study of a northern state in India has been undertaken to provide evidence based information to
1. Clinical researchers and epidemiologists for etiological studies
2. Public Health authorities to undertake control measures in terms of early detection and adequate treatment facilities for anatomical sites of cancers which are higher in magnitude.
Materials and Methods
National Cancer Registry Programme (NCRP)
NCRP was instituted by Indian Council of Medical Research (ICMR) in 1981. It has expanded into a vibrant network of multi-disciplinary researchers representing more than 700 sources of cancer registration across country. This programme now comprises of 253 Hospital Based (HBCRs) and 38 Population Based Cancer Registries (PBCRs). Some of the registries cover entire state in North Eastern part [6]. This makes NCRP unique to study cancer occurrence gradient across geography in India. While coverage is less than 10% of total Indian population, it reflects cancer profile of country fairly well owing to representation of registries from different parts and various demographic profiles. Statistical methods for extrapolation of data have been used to arrive at national figures in its reports.
Current Study/ Project
Current project was not a replication of earlier efforts by NCRP under two major projects on (a) Development of an Atlas of Cancer in India [7] (b) Development of an Atlas of Cancer in Punjab State [8].These projects were in different time periods and geographic areas. Also, current work was a unique bridge between the state health authorities mandating recording of cancer occurrence (top down approach) along with well-maintained medical records of cancer cases diagnosed by histopathology laboratories, treated by tertiary care oncology centers and palliative care units providing scientific information on cancer (bottom up).These are accessible source of scientific information across the nation. Cases diagnosed with cancer may not have a morphological diagnosis in varying proportion of cases (2-26 % of cases in NCRP, India database) [6] but they provide systematically collected, medically observed and meticulously collated data on malignancies which no other source can provide. Hospitals in Government and Private sector, Diagnostic and Pathology laboratories in Haryana and its neighboring states (to ensure inclusion of residential cases of Haryana who seek treatment outside state) were contacted. 185 institutions were contacted and 126 centers who consented were provided access to data entry software after registration formalities were completed. Information of cancer cases diagnosed during period of project who are residents of Haryana which were transmitted through HBCRs under NCRP was also included in this study. Correctness and completeness of information was checked by visits to centers. Zone –wise training sessions were completed. Case abstraction from medical records, data entry into software provided and oncological coding were some of interactive discussions held during these sessions.
Methods of Identification of Cancer
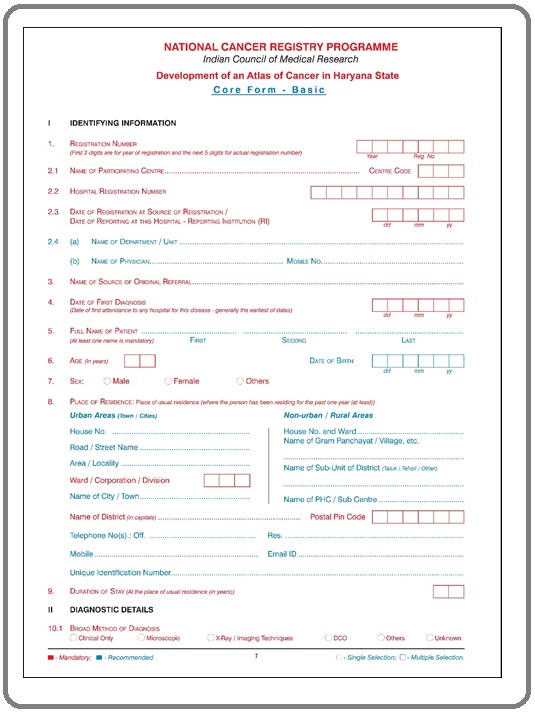
It was expected that diagnostic methods to reach a confirmed diagnosis of cancer would be a spectrum rather than singular method as far as public/private cancer centers or pathology centers having histopathology facilities are concerned. Mandatory fields which included name (with correct spellings), age at diagnosis, residential area for last one year, topography (location), morphology (microscopic appearance) of tumour and most importantly date when patient presented to medical person with an ailment which subsequently led to diagnosis of cancer. These also helped in checking for duplicate registrations. Alphanumeric code thus assigned corroborated to ICD-Oncology (ICD-O-3)
[9] and its ICD-10 equivalent was auto-coded and saved by application. A clinician (oncophysician or surgical oncologist), diagnostician (histopathologic expert) or specialist administering cancer directed treatment (i.e. radiotherapist) was assigned as Principal Investigator (PI) in each center to monitor accurate recording of above information. A classic example being cases where site of origin of tumor is not recorded and PI completes information through available sources of authentic information. Access to data entry page (which was kept practical and user-friendly) required internet and NCDIR hosted webpage (https://www.ncdirindia.org/ncrp/ca/ haryana) (Figure 1).
Figure 1. Data Entry fields - Haryana Cancer Atlas Form.
Collection of Data from Centers
Confidentiality while carrying out data entry was ensured by providing passwords to participating centers. Encrypted data so transmitted was protected. Some parts of districts (especially rural areas) where local centers lacked basic infrastructure (in terms of hardware and connectivity), data was collected by social workers at coordinating unit which was set up at Panchkula, Haryana. Coordinating unit was also issued a login-id and password to monitor as well as transmit data collected from hospitals/labs which do not have computer/ internet facilities. Institutional data sharing and processing policy along with national data sharing policy of 2012 of India was adhered to.
Collation of Data & Checks
Data quality by implementing checks which are customized for Indian settings was ensured. Improbable/ missing data was filtered out and sent back to centers. This was done to make data comparable [10] to existing national and international databases. Data where occurrence of cancer did not fall in period of analysis were excluded so also were ones, who did not reside in area which was demarcated for study. A robust de-duplication programme was implemented to eliminate duplicate registrations as cancer cases visit multiple centers prior to confirmation and commencement of treatment which may all be part of network of centers registered. De-duplication which data is subjected to, for this analysis, is based on several identifying criterion.
The Data
Database included confirmed malignancy cases (behavior code ≥ 3) coded to ICD-10 [11] with modes of diagnosis (Clinical, Microscopic, X-Ray/Imaging techniques and other valid methods). Data concerning population for all districts was available in form of standard stratified age groups including gender from census of India last carried out in 2011 [5]. For years 2016–17, this data was used as baseline to estimate populations (mid-year) for all of its districts. World standard population [12] was used to calculate age standardized/ adjusted incidence Rates (AAR). AARs of data of PBCRs [6] was used for comparison with districts of Haryana.
Cumulative risk (%) gives an estimate of person developing cancer during an average life period provided mortality does not occur from any other cause. A special effort is made for district wise calculations of risk of developing cancer during 0-64 years of age. Since data on cancer is recent, it is presumed there are no changes in trends.
Results
Of the data available at NCDIR, for most areas, lowest AARs were in PBCR of Barshi Expanded (covering rural districts of India-Osamabad and Beed), in western state of Maharashtra. Overall AARs in males for this registry (40.9/100,000) represented minimum incidence values any registry had recorded. Where finalized data had AARs lower than this, data would not be included in analysis. Overall, it was found that all 21 districts (rural predominantly) are above cut off level, either in males or females.
It was observed that there were a number of cases where there was a mismatch between coding of sites such as tongue, mouth and buccal mucosa, hence all Head and Neck sites were analyzed together as a group. This included – Tongue (C01-C02), Mouth (C03-C06), Tonsil (C09), Other Oropharynx (C10), Nasopharynx (C11), Hypopharynx (C12-13), Pharynx Unspecified (C14), and Larynx (C32).
126 centers, located in different districts of Haryana and its neighboring states registered. Eligible cases from 28 HBCRs (data of which were finalized) were also included. Data of 36736 confirmed cancers during two years (18712 and 18024 cases in years 2016 & 2017 respectively) were collected and analyzed. Minimum data (<0.5% in data) from all centers combined had unclear residential address.
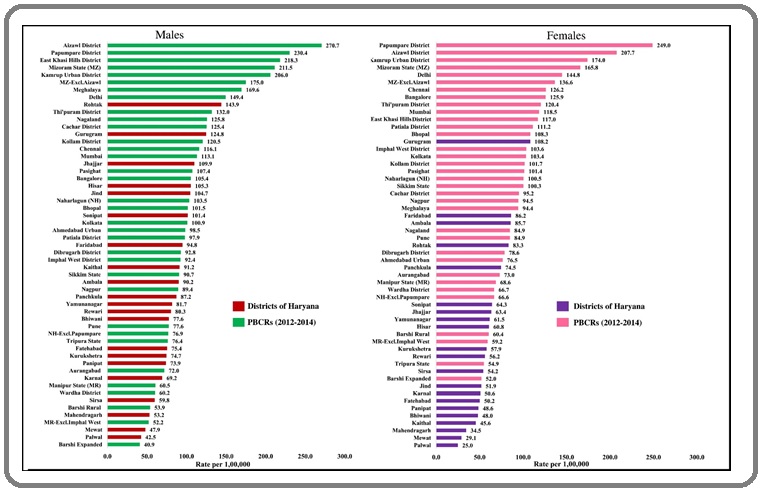
Traditionally, compared to mortality rates, incidence rates allow, a more meaningful comparison between populations, ethnic groups, countries and time periods [13]. AAR of Rohtak (143.9) district among males featured among top ten in comparison with 27 PBCRs (Figure 2(a)) while in females, Gurugram (108.2) district was in 14th position (Figure 2 (b)).
Figure 2 (a) and (b). District wise comparisons of Age Adjusted Incidence Rates (AARs) with that of PBCRs under NCDIR -All Sites (ICD-10:C00-C97) - Males & Females- (2016-2017).
For all sites of cancer put together, a belt of higher incidence of cancer is seen over Hisar (105.3), Rohtak (143.9), Jhajjar (109.9) Gurugram (124.8), Jind (104.7) and Faridabad (94.8) for males (Figure 3 (a)).
Figure 3 (a) and (b). District wise Comparison of Age Adjusted Incidence Rates (AARs) for all cancer sites (ICD-10: C00- C97) - Males and Females (2016-17).
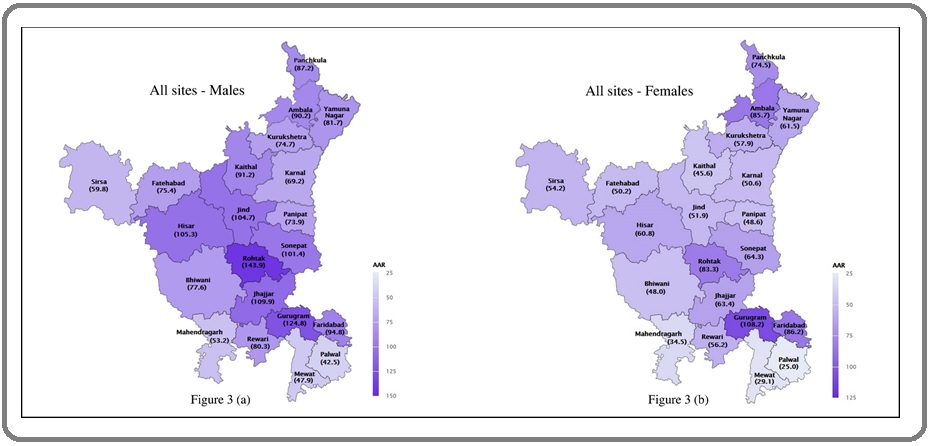
However, relatively higher rates within state were in tandem with incidence rates seen in PBCRs of neighboring state/ districts of Delhi (149.4) and Patiala (97.9) which have been functional since 1988 and 2011 respectively (Figure 2 (a)).
For females also, similar belt with relatively higher rates within state is seen (Figure 3 (b)). Rates of these districts were comparable with PBCR at Delhi (144.8) and Patiala (111.2) (Figure 2 (b)). Additionally, district of Ambala (85.7) also showed higher rates.
Respective district wise AARs are illustrated in maps showing patterns of geographic distribution of selected anatomical sites. Depending on AARs (higher of AAR 2016-17) of that site - districts displayed grade shading. Higher the AAR, darker is the shade.
Head and Neck Cancers (ICD-10: C01-06, C09-C14 & C32)
Among males, highest AAR was in Rohtak district in Haryana state (53.5). When compared with 27 pre-existing PBCRs, it ranked 4th. East Khasi Hills District had highest AAR (74.9) followed by Kamrup Urban (55.7) and Meghalaya (54.2). Jhajjar (48.9) and Jind (48.6) districts were at 5th and 6th position respectively. Rates were even higher than Aizawl (46.1) and Nagaland (47.9) (Figure 4 (a)).
Figure 4(a) and (b). District wise Comparison of Age Adjusted Incidence Rates (AARs) Head and Neck Cancers (ICD-10: C01-06, C09-C14 & C32) – Males and Females (2016-17).
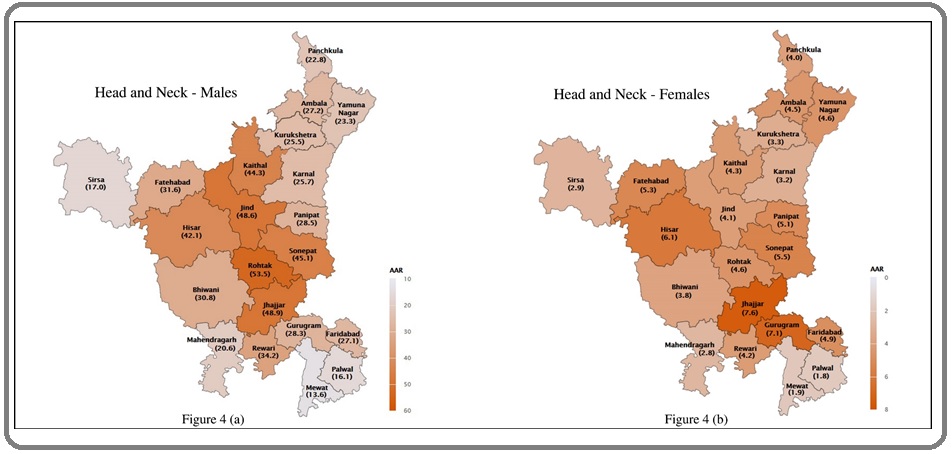
Among females, districts of Haryana had relatively lower incidence when compared to PBCRs which ranged between 2.8 - 25.0 with Papumpure District leading list. Palwal District had lowest incidence rate (1.8). Jhajjar (7.6) was highest among females (Figure 4 (b)).
Lung (C33-34) and Prostate (C61) – Males
For lung, hitherto, highest AAR in Indian PBCRs was in Aizawl (37.9) and lowest in Barshi Expanded (2.1). In Haryana, districts had AARs ranging between 5.0 -15.1, with highest in Rohtak and lowest in Palwal (Figure 5 (a)).
Figure 5 (a) and (b). District wise Comparison of Age Adjusted Incidence Rates (AAR) per 100,000– Cancer Lung and Cancer Prostate –Males -. (2016-2017).
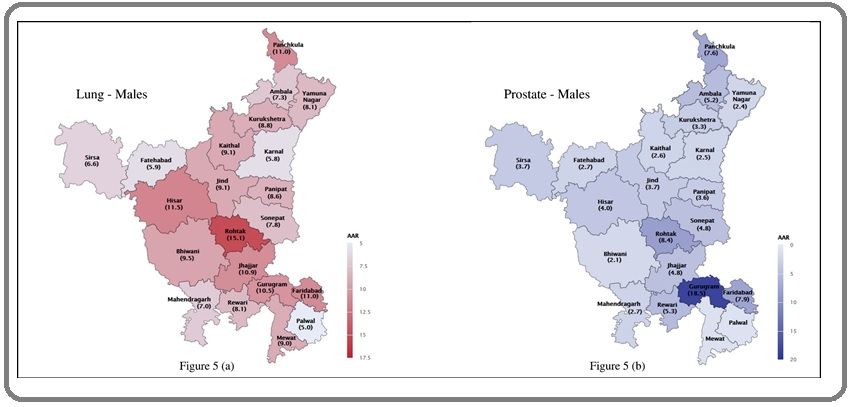
For prostate, highest AAR was in Gurugram district in Haryana State (18.5), a rate higher than in nearby Delhi PBCR (12.4) and Kamrup Urban (12.2) which were highest in India. Rohtak (8.4), Faridabad (7.9) and Panchkula (7.6) also were among top 10 districts when compared to PBCRs with 6th, 9th & 10thposition respectively (Figure 5 (b)).
Breast (C50) and Cervix Uteri (C53) – Females
Incidence of cancer Breast was highest in Gurugram (34.5) in Haryana while it was third in comparison with PBCRs where Delhi (41.0) and Chennai (37.9) were highest. Ambala had an incidence of 26.8. Lowest AAR of Cancer Breast was in Naharlagun, while in Haryana, lowest rate was in Palwal District (5.2) (Figure 6 (a)).
Figure 6(a) and (b). District wise Comparison of Age Adjusted Incidence Rates (AAR) per 100,000. – Cancer Breast and Cancer Cervix –Females- (2016-2017).
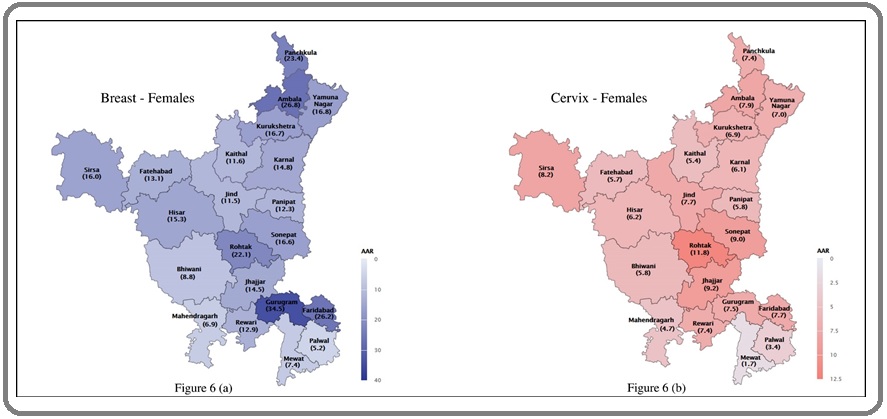
Cancer of cervix in India has shown high incidence, with highest rates observed in Papumpare district which was 30.2. In Haryana, Rohtak district had highest rate (11.8), Mewat (1.7) had lowest AAR which was also lowest in comparison with PBCRs (Figure 6 (b)).
Anatomical site of origin not known
These were less than 10% in 19 of 21 districts. Two districts Mewat (15.3 %) and Yamunanagar (10.8%), had relatively higher proportion.
Risk of Cancer
According to National Health Profile-India 2019 [14] life expectancy in state, for years 2016-2020 was 69.9y in males and 72.5y in females. Cumulative risk calculations depicted a risk of 9.0% of males aged 0-64 years in Rohtak District and those of Palwal District at 3.2% are least at risk. Among females, depiction indicated that 7.2% risk in Gurugram District whereas in Palwal District risk is 1.9%. Risk is that of developing cancer in age group defined.
Tobacco Related Cancers
There are cancers of several anatomical sites known to be related to tobacco use. NCRP has been using classification provided by International Agency for Research on Cancer (IARC), World Health Organization monographs on overall evaluations of carcinogenicity [15]. Earlier listing has been retained for comparison purposes though recent monographs have more anatomical sites. Relative proportions of cancers of such sites, were found to be high in Kaithal district among males (58.6%) while Kaithal and Hisar district had 20.8% and 20.6% among females respectively. These are semi-urban districts of state where urbanization is expected in coming years. In males, lowest proportion of tobacco related cancers (TRCs) was in Gurugram district (37.2%) whereas in females lowest proportion for TRCs was observed in Mewat District (10.2%).
Discussion
Charting geographic distribution of cancer is an effective monitoring and evaluation tool used in differentiating risk factors of cancers according to usual address where case resides. There is convincing evidence from Australia [2] and Scotland [3] in this regard.
Uniformity in data collection from geographic areas is the key feature for an atlas. Official mortality data has not been collected completely in a developing country like India as reliability on cause of death is proportionately less. Medically certified death certificate in mortality data even among cancer registries which are in selected (usually urban) areas [16] is difficult. Approach in this study, has been to focus on incidence data using widely available resources like Cancer Centers, Medical Colleges, General Hospitals (Public/ Private) and pathology laboratories.
Haryana, presently, does not have a functioning PBCR within geographical limits to bring out magnitude of cancer or similarities. Earlier publications based on NCRP data gave indications of incidence rates lower than North Eastern states in Haryana [17]. Cancer atlas India (2001-02) could cover only 2 districts of Haryana including Ambala and Panchkula along with its Capital City (Chandigarh) [7].
Coordinating unit at Panchkula district undertook task of collecting information from eligible cases from other hospitals which were not in network and transmitted same through website. Regular reviews by authorities along with awareness about risk factors, preventive measures & common symptoms have helped in early detection thereby improving case coverage. Beneficiaries (i.e. under Free Bus Pass) for treatment and follow up of cancer cases contributed towards improving coverage in some regions of state.
Though collection of data of cancer registration is almost never real time [18], in Cancer Atlas Haryana, data of 2016-17 has been received by December 2018. Retrospective and current data collected through project has undergone checks as per international norms. Hence, data till December 2017 (which was received till December 2018) has been subjected to checks and feedback taken from center.
Records from each center were sorted by name, unique identification number, mobile number, address, hospital, date of first diagnosis and other identifying information. ‘Prevalent’ registrations were less in this project, since investigators were aware and trained to restrict to ‘date of First Diagnosis’ falling in years when data collection was ongoing.
In conclusion, Haryana Cancer Atlas has provided evidence based information regarding presence of higher risk areas of specific cancers and paves way for future epidemiological studies. Unrestricted use of tobacco (in all forms) and related products despite explicit illustrations on the packaging are factors playing a role indicated by contiguous areas of high incidence of tobacco related cancers (Head & Neck, Lung) in the state. Higher incidence of certain cancers associated with reproductive system of both men (prostate) and women (cervix and breast) implicates factors i.e. changing lifestyles. Screening enabling early detection i.e. prostate specific antigen for men and pap smear/awareness of self-examination for women are feasible and affordable methods which can reduce burden on oncology facilities. PBCRs in suitable districts are recommended. Economy of study especially from public health perspective in a scenario of developing country is noteworthy. Rapid urbanization phase of state was the correct time to capture status of cancer which would transform into advanced area with technological evolution. A comparison of incidence rates then would give some direct clues regarding trends effecting cancer. A similar effort of incidence data recording for defined period for individual states of India which are units independently dealing with subject of health, would bring us closer to measuring actual burden of cancer in India. Effort has to be done in a phased manner keeping vastness and density of population of Indian Peninsula in consideration. All cancer centers, medical colleges and hospitals, diagnostic labs within and outside Haryana continue transmitting data to NCDIR-NCRP using HBCRDM and HCA software (indigenously developed by NCRP). Project has acted as a catalyst for some HBCRs which had registered with NCRP but were idle have now started active data transmission. Health informatics has emerged as a valuable asset to measure magnitude of disease as well as its patterns. Optimum usage of informatics would catapult us to knowledge of dealing with a disease like cancer in its entirety. Capture of disease status or picture has challenges. This study is an effort to overcome the same.
Acknowledgements
The study ‘Development of an Atlas on cancer in Haryana State’ was conducted by National Cancer Registry Programme of India housed at National Centre for Disease Informatics and Research (NCDIR) .The authors like to place on record the significant contributions of the faculty of the collaborating centers and staff at the coordinating unit.
Funding
Supported by Department of Health Research (DHR) under the Ministry of Health and Family Welfare (MoH&FW) under the aegis of Indian Council of Medical Research.
References
- Bray F, Znaor A, Cueva P, et al (eds): Planning and Developing Population-Based Cancer Registration in Low- and Middle-Income Settings. Lyon, France, IARC Technical Publication, 2014 .
- Australian Cancer Atlas (https://atlas.cancer.org.au). Cancer Council Queensland, Queensland University of Technology, Cooperative Research Centre for Spatial Information. Version 09-2018. Accessed [04 Aug 2020] .
- Kemp I, Boyle P, Smans M, Muir C (eds). Atlas of cancer in Scotland, 1975-1980. Incidence and epidemiological perspectives. IARC Sc. Pub. No. 72. Lyon: IARC, 1985 .
- Atlas of cancer incidence in the Nordic countries. Helsinki: Nordic Cancer Union, 1988 Jensen OM, Carstensen B, Glattre E, Malker B, Pukkala E, Tulinius H. .
- Census of India - Registrar General of India, Socio Cultural Tables, C14, Population by Five Year Age Group, by Residence and Sex 2001 & 2011, New Delhi, www.censusindia.net .
- National Centre for Disease Informatics and Research: Consolidated Report of Population Based Cancer Registries, 2012-2014 Bengaluru, India, National Cancer Registry Programme (NCRP-ICMR) https://ncdirindia.org/Reports.aspx .
- Development of an Atlas of Cancer in India, 2001- 2002, Volume I & II, National Cancer Registry Programme, (Indian Council of Medical Research), Bangalore, www.canceratlasindia.org 2004 .
- Development of an Atlas of Cancer in Punjab State (PCA) 2012- 2013, National Cancer Registry Programme (Indian Council of Medical Research), Bangalore, http://ncdirindia.org/ncrp/pca/ .
- Fritz, A., Percy, C., Jack, A., Shanmugaratnam, K., Sobin, L., Parkin, D.M. and Whelan, S (eds). International Classification of Diseases for Oncology (ICD-O) Third Edition, Geneva: 2000, WHO, 2000 .
- Comparability and Quality Control in cancer registration. Lyon: IARC Parkin DM, Chen VW, Ferlay J, Galceran J, Storam HH, Whelan SL. 1994.
- International Statistical Classification of Diseases and Related Health Problems - 10th revision, World Health Organization, Geneva, 2008 WHO . .
- Cancer Mortality for Selected Sites in 24 Countries (1950-57) Segi M. Sendai, Tohoku University School of Medicine, Dept. of Public Health, Japan Cancer Society.1960.
- Textbook of Cancer Epidemiology, Second edition, New York, Oxford University Press, ISBN-13: 9780195311174 Hans-Olov A, David H, Dimitrios T. 2009;:34.
- Central Bureau of Health Intelligence National Health Profile (14th issue), India, https://www.cbhidghs.nic.in/, 2019..
- IARC Monographs - Supplement 7, Overall evaluations of carcinogenicity; An updating of IARC monographs Volume 1-42: IARC monographs on the evaluation of the carcinogenic risks to humans IARC Lyon.1987;:357-361.
- Geographic pathology revisited: Development of an atlas of cancer in India Nandakumar Ambakumar, Gupta Prakash Chandra, Gangadharan Paleth, Visweswara Rudrapatna Narayanrao, Parkin Donald Maxwell. International Journal of Cancer.2005;116(5). CrossRef
- The burden of cancers and their variations across the states of India: the Global Burden of Disease Study 1990–2016 Dhillon Preet K, Mathur Prashant, Nandakumar A, Fitzmaurice Christina, Kumar G Anil, Mehrotra Ravi, Shukla D K, et al . The Lancet Oncology.2018;19(10). CrossRef
- Forman D, Bray F, Brewster DH, et al (eds): Cancer Incidence in Five Continents Volume X. Lyon, France, IARC Scientific Publications, 2014 .
License

This work is licensed under a Creative Commons Attribution-NonCommercial 4.0 International License.
Copyright
© Asian Pacific Journal of Cancer Care , 2021
Author Details
How to Cite
- Abstract viewed - 0 times
- PDF (FULL TEXT) downloaded - 0 times
- Xml downloaded - 0 times